As stated before, the problem at “Carson Lake and Pasture” is poor water quality. The surface water comes from the drains but the drains have both surface farm run-off and ground water seepage. Ground water is the greater problem.
Shallow ground water in the Carson Desert is generally not affected by deeper water. Morgan (1982) and Fosbury (2008, referencing his 2007 M.S. thesis) inferred a contribution from upward flowing geothermal water in the Stillwater area but this contribution is minor and areally restricted. Vertical gradients are generally downward although there are some inconsistencies. Water levels are affected by proximity to canals and drains (Glancy, 1986, p. 39). In 3 well clusters at Dodge Ranch, northwest of “Carson Lake” with the shallowest wells about 3 m (10′) deep, the mid-depth wells about 6 m (20′) deep, and the deepest wells deeper than 8.8 m (29′), 2 well clusters had downward gradients and the other had no gradient (Lico and others, 1986, Table 3, p. 16-17). 3 well pairs at “Harmon Lake”, east of Fallon, had downward, upward, and no vertical gradients (Lico and others, 1986, Table 4, p. 18). Of 8 wells in the “Lead Lake” area at Stillwater National Wildlife Refuge ranging in depth from 3.4 m (11′) to 6 m (20′), the 4 deepest wells had the deepest water levels and the 4 shallowest wells had the shallowest water levels (Rowe and others, 1991, Table 25, p. 178).
Ground water quality is partly controlled by the quality of recharge water. Before irrigation, ground water of “Carson Lake and Pasture” was recharged by water that leaked out of the river channels and by flood waters that percolated downward through interchannel areas. The Newlands Project changed that. Now the recharge comes from canal seepage and water percolating down through irrigated crop lands spread across a broad area. Ground water recharge near Fallon has been estimated to be 56% from canal seepage, 37% from “irrigation losses” (this may mean downward percolation from flooded fields), 5% from precipitation, and 8% from drains (U.S. Bureau of Reclamation, 2013, p. 3-60). The Truckee-Carson Irrigation District (2010, Table 6, p. 2-8) estimated that 13.6% of 2009’s water supply was lost to canal seepage and that 10.6% of the water delivered to farmers was left as “percolation from agricultural land”. The volume of percolation was about half as much as seepage. “Percolation” could be the same as “irrigation loss”.
Except for arsenic above the U.S. Environmental Protection Agency’s maximum contaminant level of 0.010 mg/L, the quality of water from the Carson River below Lahontan Dam is good. As shown in the table of Major and Trace Element Concentrations in Water from the Carson River Below Lahontan Dam, the water quality is better during the irrigation season when flows are high than in the winter. The October 1988 sample is an outlier as concentrations were generally double those in the August sample. It may have been affected by evaporation from “Lahontan Reservoir” in spite of the season. For this discussion, samples collected below Lahontan Dam on May 11, 1987 (Hoffman and others, 1990, p. 87-93), September 25, 1987, and August 19, 1988 (Rowe and others, 1991, site 2, p. 90-114) were averaged to give a starting point for the evolution of ground water reaching wells in the Carson Desert.
The first 2 analyses are from Hoffman and others (1990, p. 87-93) and the others are from Rowe and others (1991, p. 90-116).

The worst effect of the Newlands Project on water quality has been raising the water table. In 1904, depths to water measured in wells were generally shallower than 1.5 m (5′) within a few hundred meters of river channels, shallower than 3 m (10′) within a couple of km of river channels, and 3-7.6 m (10-25′) farther away (Maurer and others, 1993, Figure 8, p. 34). Depths to water were greater than 7.6 m (25′) around “Soda Lake” west of Fallon and in the area east of Old River northeast of Fallon. The rise caused by the Newlands Project was so great that drains had to be constructed to avoid water-logged fields. The shallow 1.2-2.4 m (4-8′) depths of drains constructed before 1993 (Maurer and others, 1993, p. 39) indicate the water table was raised to depths of less than 1.2 m (4′) in some places. Even after decades of drains in place, depths to water were less than 3 m (10′) under areas of irrigated lands more than 8 km (5 miles) across in 1992 and were more than 4.6 m (15′) shallower “over large areas northeast of Fallon” (Maurer and others, 1993, p. 32 and Figure 8, p. 35). Many of the domestic wells in the “shallow aquifer” (i.e., less than 15.2 m, 50′, deep) tabulated by Glancy (1986, p. 40) had depths to water shallower than 1.5 m (5′).
Newlands Shallow Ground Water – top
A shallower water table has had 3 negative consequences for water quality that I can think of.
- Previously unsaturated sediments are now saturated and susceptible to leaching. Because some downward percolating water evaporates in the unsaturated zone before reaching the water table, the solutes left behind in the unsaturated zone over the past decades or centuries could be mobilized into ground water along with whatever soluble minerals or adsorbed ions the sediments have.
- The area of the water table less than 3 m (10′) deep and, hence, susceptible to evapotranspiration (Herrera and others, 2000, p. 28), has increased. Evapotranspiration increases the concentrations of all the constituents in the ground water.
- Drains have been dug to below the water table in order to lower it and they are working. Shallow ground water seeps into the drains and some shallow ground water has very poor water quality, as will be shown below. Once in the drains, it can flow to “Carson Lake”.
It is also important to consider the residence time of water in the newly saturated zone. Some water-sediment reactions are slow so the longer water remains in contact with sediments, the more dissolved constituents it can acquire. The rate of ground water flow through the sediments near Fallon varies greatly. Water in former river channels, which have more sand and gravel and consequently greater porosity and permeability, flows faster than water in former interchannel or flood plain deposits dominated by finer grained sediments and clay. An analysis of 69 domestic wells less than 15 m (50′) deep found lateral hydraulic conductivities of 1.8-146 m/day (6-480 feet/day). Slug tests of 17 test wells which, unlike domestic wells, were not selected based on their ability to produce usable amounts of water, indicated lateral hydraulic conductivities of 0.003-274 m/day (0.01-900 feet/day) (Herrera and others, 1999, p. 10-11). This is a range of 5 orders of magnitude. For the following illustrative purpose, this range is truncated to 3 orders of magnitude. The regional horizontal ground water gradient north of “Carson Lake” is 0.00114 (Herrera and others, 1999, p. 8). Multiplying the truncated conductivities of 0.03-27.4 m/day (0.01-90 feet/day) by the gradient indicates that much of the ground water north of “Carson Lake” flows at rates of 0.0125-11.4 m/year (0.041-37.4 feet/year). It could take ground water anywhere from 88 to 80,000 years to flow 1 km (0.6 miles). This is after the water gets to the saturated zone. I have found no estimates of seepage rates through the unsaturated zone.
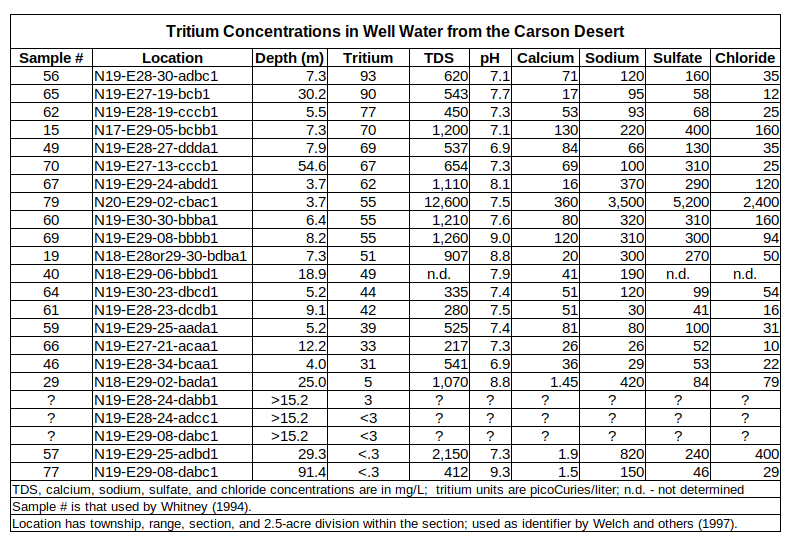
Thanks to nuclear weapons testing that released tritium into the atmosphere, there is another way to estimate residence time. Tritium concentrations in ground water indicate when the recharge sank into the ground and became isolated from tritium in the atmosphere. Tritium data for samples from 23 wells were reported by Whitney (1994, Table 39, p. 123-124) and by Welch and others (1997, Table 5, p. A33). Whitney (1994) also has well depths and chemical data. All but 3 of the samples of Welch and others (1997) have depth and chemical data in Whitney (1994). If tritium concentrations are greater than 10 picoCuries/liter, the water fell as precipitation more recently than 1959 (Welch and others, 1997, p. A32).
As shown in the table of Tritium Concentrations in Well Water from the Carson Desert, all the samples from wells less than 15 m (49′) deep are younger than 1959. All the samples older than 1959 are from wells more than 15 m (49′) deep. High tritium concentrations in samples from wells 30.2 m (99′) and 54.6 m (178′) deep could be due to young water flowing down an improperly sealed well annulus or they could reflect very thick sections of permeable sand that allow relatively rapid vertical flow. Notwithstanding extremely slow flow rates through some Lake Lahontan sediments, these results indicate that the shallow ground water under the irrigated lands of the Carson Desert is dominantly, if not exclusively, Newlands irrigation water. It is important to note that such young water can have high major element concentrations, as shown in the table.
Tritium data are from Whitney (1994) and Welch and others (1997); well depths and major element concentrations are from Whitney (1994).
Newlands Shallow Ground Water – top
Before considering the chemistry of the drain water that flows into “Carson Lake and Pasture”, a review of ground water chemistry is necessary because ground water seeps into the drains. The discussion and the graphs that follow are based on the data sources below.
- Morgan, 1982, U.S.G.S. Open-File Report 82-345; 2 wells privately drilled for geothermal resources (94.0 and 95.7 C) with mid-screen depths of 56.7 and 70.1 m (186′ and 230′) and 15 U.S.G.S test wells and augur holes with mid-screen depths 1.7-45.4 m (5.6-149′), all but 2 with temperatures less than 25 C; all the wells were in the Stillwater geothermal area, which is in and near the west side of Stillwater National Wildlife Refuge; no analyses of mercury, selenium, or uranium.
- Glancy, 1986, U.S.G.S. Water-Supply Paper 2263: 10 selected domestic wells less than 15.2 m (51′) deep and 7 domestic wells 30-71 m (95-234′) deep; analyses by Nevada Bureau of Consumer Health with arsenic but without carbonate, boron, lithium, mercury, selenium, or uranium.
- Hoffman and others, 1990, U.S.G.S. Water-Resources Investigations Report 89-4105; 6 U.S.G.S. test wells and augur holes 4-9.3 m (13.3-30.5′) deep near “Carson Lake”, “Harmon Lake”, and in the Stillwater National Wildlife Refuge; all have mercury concentrations less than or equal to 0.0001 mg/L and selenium concentrations less than 0.001 mg/L.
- Rowe and others, 1991, U.S.G.S. Open-File Report 91-185: 8 U.S.G.S. test wells at “Lead Lake”, Stillwater National Wildlife Refuge, 3.5-6 m (11.5-20′) deep sampled on 3 dates which have been averaged for this discussion and 1 test well 6 m (20′) deep on the Fallon Paiute-Shoshone Reservation; 1 sample has 0.0006 mg/L mercury, all the rest have less than 0.0001 mg/L; 6 of 9 wells have less than 0.001 mg/L selenium.
- Whitney, 1994, U.S.G.S. Open-File Report 94-39: 17 domestic wells 19-55 m (62-180′) deep, 55 U.S.G.S. augur holes and test wells 2-19 m (7-63′) deep throughout the irrigated area around Fallon but not extending into Stillwater National Wildlife Refuge, including well clusters to determine water quality changes with depth in “Carson Lake and Pasture” and at the Fallon Agricultural Station on the south edge of Fallon; results for duplicate samples were averaged for this discussion; all samples have less than 0.0001 mg/L mercury and 42 of 76 samples have less than 0.001 mg/L selenium.
- Fosbury and others, 2008, U.S.G.S. Open-File Report 2008-1201: 29 domestic wells with depths less than 16 m (53′), 1 domestic well with depth 44 m (145′), 5 geothermal (40-142 C) domestic wells with depths 125-814 m (410-2,672′), 5 geothermal (33-216 C) domestic wells 9-70 m (30-230′) deep in the Stillwater geothermal area; all analyses by Nevada State Health Laboratory and without uranium; all samples have less than 0.0002 mg/L mercury, 12 of 40 have less than 0.001 mg/L selenium.
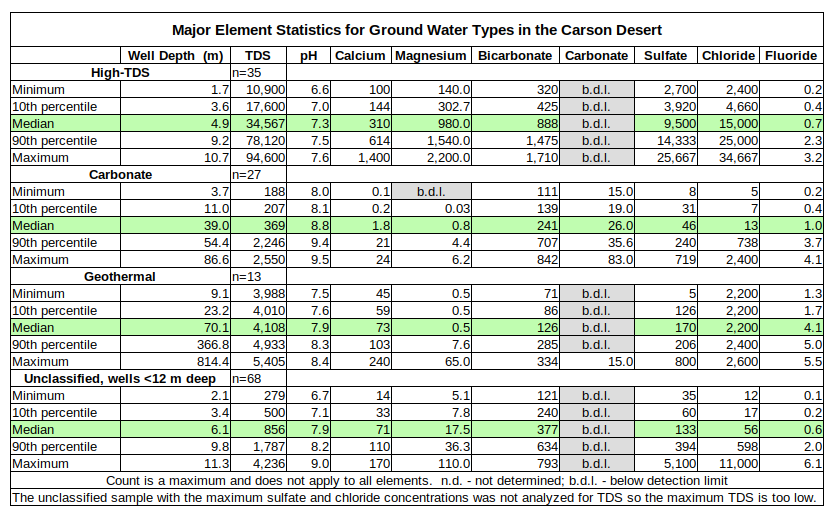
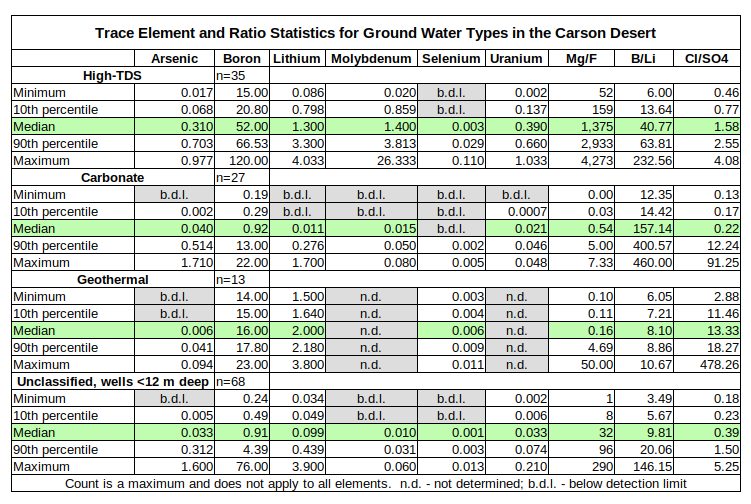
Ground water samples from the Carson Desert have rather extreme ranges for major, minor, and trace elements as shown in the tables for Major Element Statistics for Ground Water Types in the Carson Desert and Trace Element Statistics for Ground Water Types in the Carson Desert. To provide some context for these ranges, 3 distinct water types are identified here: high-TDS waters, carbonate waters, and geothermal waters. Ranges, medians, and percentiles for selected elements are summarized in the tables below. Mercury is not included because almost all ground water samples had mercury concentrations below the detection limits or mercury was not analyzed. In addition to the statistics of some individual elements, certain element ratios are also helpful in distinguishing these water types.
See list of sources above.
See list of sources above.
Newlands Shallow Ground Water – top
The geothermal water samples had temperatures of 39.7-216 C. The next highest temperature was 33.2 C in a domestic well less than 12 m deep, which might or might not have a geothermal component. All but 1 of the geothermal samples are from wells more than 12 m deep. By definition, geothermal water has circulated deeply enough to become heated. Such waters have consequently interacted with sediments and rocks other than the Fallon Formation and the upper part of the Lahontan Valley group and they have done so for a much longer period of time than shallow ground water. Geothermal waters are not derived from the Carson River but the samples are plotted on the graphs that follow and their statistics are summarized in the tables so that the reader can ascertain whether geothermal water contributes to the poor water quality of “Carson Lake and Pasture”.
Carbonate waters are defined primarily by carbonate concentrations greater than 15 ppm or so. However, not all reports analyzed for carbonate. Carbonate waters can also be distinguished from geothermal and high-TDS waters by calcium concentrations less than 25 ppm but this threshold might not hold for some of the many samples from wells less than 12 m deep if their carbonate concentrations were known. Carbonate waters also have relatively alkaline pH of 8.0 or more, magnesium concentrations less than 8 mg/L, and manganese concentrations less than 0.08 mg/L. A plot of calcium versus sulfate (not shown) shows the carbonate waters in a field defined by calcium less than 25 mg/L and sulfate less than 300 mg/L with only 2 unclassified samples from wells less than 12 m deep and 6 unclassified 12-40 m samples. Boron to lithium (B/Li) ratios greater than 100 also help separate carbonate waters from geothermal waters. Most of the carbonate samples are from wells more than 12 m deep. 4 of the tritium analyses were of carbonate-type: samples 19, 29, 57, and 77. 3 had tritium concentrations less than 10 picoCuries/liter and have been in the ground since before 1960.
High-TDS waters are characterized by high concentrations of just about everything, particularly TDS concentrations greater than 10,000 mg/L (range 10,900-94,600 mg/L), sodium concentrations greater than 2,500 mg/L (range 2,600-24,667 mg/L), magnesium concentrations greater than 120 mg/L (range 140-2,200 mg/L), and sulfate concentrations greater than 2,500 mg/L (range 2,700-25,667). Of the trace elements, boron, molybdenum, and uranium concentrations in high-TDS waters are greater than those in most other ground water samples. Magnesium to fluoride (Mg/F) ratios greater than 100 distinguish high-TDS waters from carbonate and geothermal waters, which have ratios less than 10. High-TDS waters have chloride to sulfate (Cl/SO4) ratios less than 5 whereas geothermal waters have ratios greater than 10. All the high-TDS-type samples came from wells less than 12 m deep. The one tritium analysis of a high-TDS sample, #79, indicated it is younger than 1959.
Samples that did not fit into the 3 water types are distinguished on the graphs by well depths: less than 12 m or 12-40 m. It would be possible to assign some of these unclassified samples to 1 of the 3 water types but at the expense of widening the ranges for certain elements or ratios. More detailed analysis could distinguish additional water types.
Newlands Shallow Ground Water – top
As evaporation must play an important role in determining the quality of shallow ground water in the Carson Desert, chloride was chosen as the x-axis for the graphs. The most common chloride-bearing mineral is halite but halite doesn’t precipitate until sodium and chloride concentrations are much higher than those in Carson Desert ground water samples. Consequently, the chloride stays in solution and its concentration increases steadily as water evaporates. Lico (1994, p. 47) also used chloride as a measure of the degree of evaporation. As shown in the graph below, chloride is also useful because it has a strong positive correlation with TDS and specific conductance. Some reports didn’t analyze for TDS and some didn’t measure specific conductance so chloride provides a way to compare them all.
The graph of Total Dissolved Solids and Chloride Concentrations in Carson Desert Ground Water shows extreme ranges for both variables. Based on the secondary drinking water standards, most of the samples would not be palatable. For samples that were not analyzed for TDS, specific conductance is plotted against chloride. Like TDS, specific conductance increases steadily with chloride concentrations. Conveniently, TDS in units of mg/L and specific conductance in units of microSiemens per centimeter have similar ranges.
CR below LD – Carson River below Lahontan Dam
Spec. Cond. (uS/cm) – specific conductance, units of microSiemens per centimeter
See text for definitions of carbonate, geothermal, and high-TDS water types.
Unclassified samples are categorized by well depths of less than 12 m (39′) or 12-40 m (39-131′).
TDS 2nd drinking water – The U.S. Environmental Protection Agency’s secondary TDS standard for drinking water is 500 mg/L.
Cl 2nd drinking water – The U.S. Environmental Protection Agency’s secondary chloride standard for drinking water is 250 mg/L.
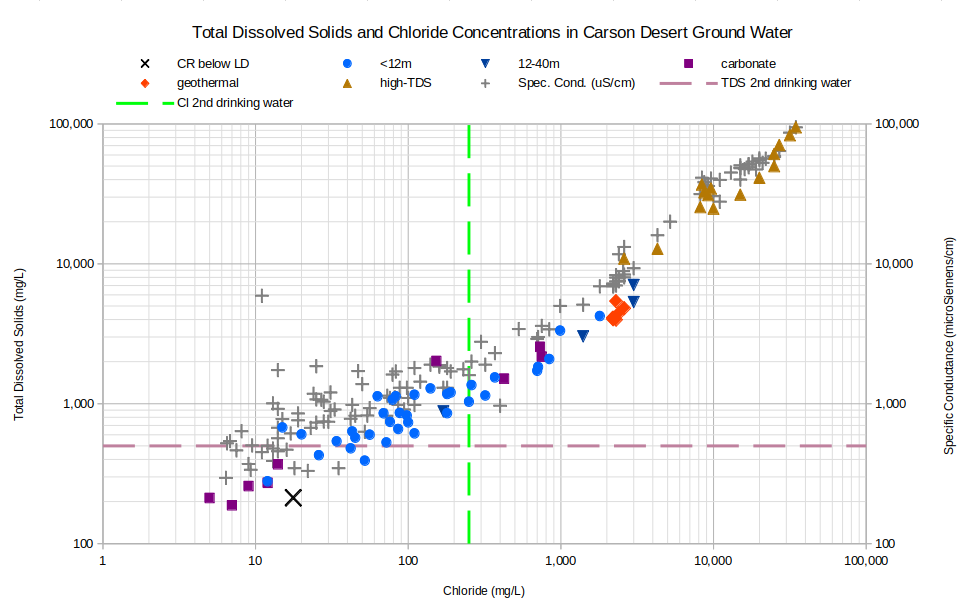
Chloride concentrations that are less than 18 mg/L cannot be explained by evaporation of the average Carson River water used here. An attempt to download chloride and TDS concentrations from the U.S. Geological Survey web site for the sampling site of the Carson River below Lahontan Dam (https://nwis.waterdata.usgs.gov/usa/nwis/qwdata/?site_no=10312150) yielded only 18 values, including the 3 used for the average. Significantly, samples collected in July and August of 1980 had chloride concentrations of 6.6 and 6.2 mg/L. It seems likely, then, that ground water samples with chloride concentrations less than 18 mg/L were derived from mixtures of Carson River and Truckee River waters in Lahontan Reservoir that also had chloride concentrations less than 18 mg/L. Similarly, there could be ground water samples that were derived from river water with TDS concentrations greater than 213 mg/L.
The graph of Sodium and Chloride Concentrations in Carson Desert Ground Water provides a check on the assumption that chloride increases only due to evaporation. The dotted line shows how sodium and chloride concentrations would increase as Carson River water evaporated. The weight ratio of sodium and chloride in the water would remain the same as the starting ratio. The dashed line shows how the concentrations would change if sodium and chloride were added to the water by dissolution of halite. Halite has 1 mole of sodium per 1 mole of chloride but chlorine has a higher atomic weight than sodium so the weight of chloride in the water increases more than the weight of sodium as each increment of halite is dissolved. As more halite is dissolved, the water develops a weight ratio of sodium to chloride that is the same as the ratio of their atomic weights. The atomic weight ratio is less than the Carson River ratio so the dashed line is below or to the right of the dotted line.
CR below LD – Carson River below Lahontan Dam
See text for definitions of carbonate, geothermal, and high-TDS water types.
Unclassified samples are categorized by well depths of less than 12 m (39′) or 12-40 m (39-131′).
Cl 2nd drinking water – The U.S. Environmental Protection Agency’s secondary chloride standard for drinking water is 250 mg/L.
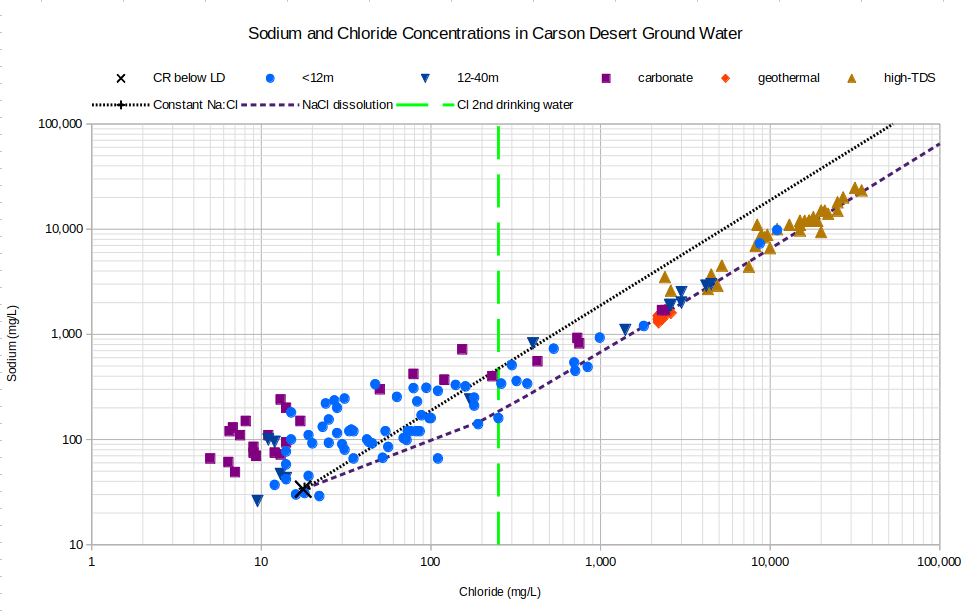
It sure looks like high-TDS waters have dissolved halite. If high-TDS waters have dissolved halite, their shallow depths and young ages, at least for some, indicate that halite must have been present close to the surface. That could be true but shallow halite has not been documented (see Sediments of Lake Lahontan). Geothermal waters were not derived from Carson-Truckee river water so their proximity to the halite dissolution line is likely coincidental. Alternatively, high-TDS waters could be shifted below the evaporation line by loss of sodium due to precipitation. There are too many possibilities for sodium precipitation without chloride to describe here but Knight (1935) mentioned the presence of sodium carbonate in pre-irrigation soils. If evaporating pre-irrigation flood waters could precipitate sodium carbonate, maybe Newlands Project water can too.
Newlands Shallow Ground Water – top
The cluster of carbonate-type waters with chloride concentrations less than average Carson-Truckee river water suggests that some process has removed chloride from those waters. If so, the process could not have been halite precipitation as that would also have decreased sodium concentrations to less than the average concentration below Lahontan Dam.
Many of the unclassified shallow well samples with chloride concentrations less than 200 mg/L plot above, or to the left of, the constant sodium to chloride ratio line that maps the evaporation trajectory from Carson River water. This could be due to gains of sodium from dissolution of sodium bicarbonate but reactions with clays or other sodium-bearing minerals are also plausible. A decrease in chloride concentrations like what happened in the carbonate-type waters is possible but remains enigmatic.
A range of chloride concentrations from 20 to 30,000 mg/L seems to require extreme evaporative enrichment. Evaporation occurs from the canals before the water is delivered to the fields, from the flooded fields, from the unsaturated zone as water trickles down to the water table, and from shallow ground water. In the Great Basin, evapotranspiration reaches to a depth of about 3 m (10′) (Herrera and others, 2000, p. 28). Almost all of the samples are from wells deeper than 3 m but all the sample waters must have passed through the evapotranspiration zone in the past. Even if the high-TDS waters have had their sodium and chloride concentrations increased by halite dissolution, concentrations of other elements have also been greatly increased, as shown in other graphs below. For example, the 90th percentile concentrations of the high-TDS-type samples are greater than concentrations in the Carson River below Lahontan Dam by factors of 85 for potassium, 210 for magnesium, 320 for sulfate, 500 for sodium, and 1,400 for chloride. The factors aren’t all the same, or even close, so evaporation isn’t the only process at work here. Halite dissolution and various other mineral-water reactions must account for the specific differences in enrichments of these major elements.
It is not obvious whether the extreme enrichments in the high-TDS water type occurred in the subsurface or at the surface. Waters under drying marshes could have greater enrichments due to greater transpiration than those under barren playas as long as the waters haven’t flowed laterally to a different environment. Alternatively, the high-TDS-type waters could be associated with relatively impermeable sediments which prolonged the transits from the surface to below the bottom of the evapotranspiration zone at about 3 m (10′).
Another possibility is that the high-TDS waters could have experienced their extreme evaporation as ponded surface water. They may represent water that seeped into the ground as a pond shrank or dried up completely. All the samples from wells in “Carson Lake” had sums of major elements, which are close to TDS concentrations, of 29,500-49,500 ppm (Whitney, 1994, p. 101) and all those from wells at “Lead Lake” at Stillwater National Wildlife Refuge had concentrations of 10,900-94,600 ppm (Rowe and others, 1991, p. 187). Surface water of Pintail Bay, which is a sump of Stillwater National Wildlife Refuge had TDS concentrations of 12,200-35,000 mg/L (Lico, 1992, p. 17).
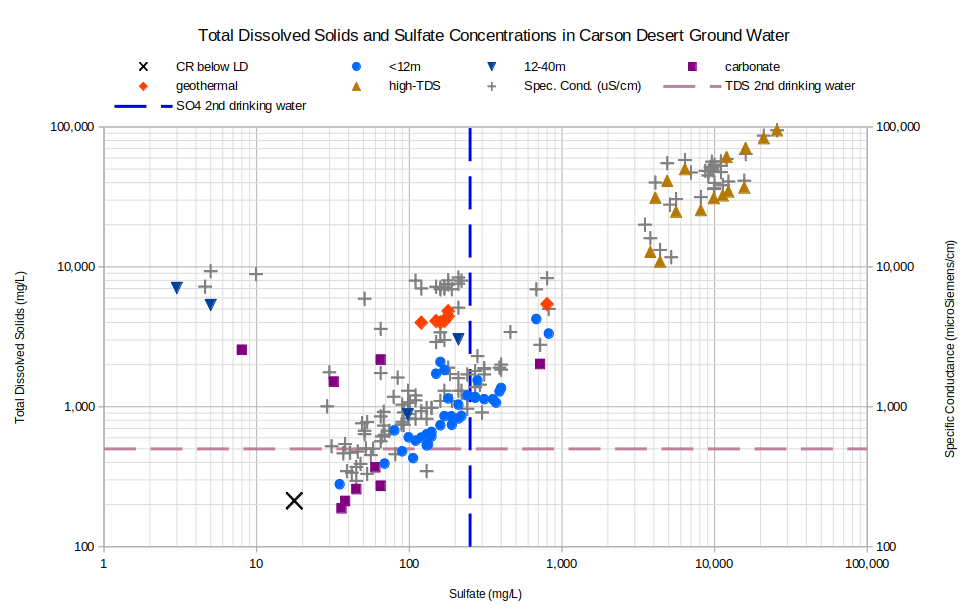
Lico (1992, p. 47-51) interpreted 6 ground water samples from the “Lead Lake” area of Stillwater National Wildlife Refuge in terms of the evolution of water with the lowest TDS concentration to water with the highest TDS concentration. “Evaporation appears to be the dominant process” (Lico, 1992, p. 47). All his samples fit the criteria of the high-TDS category of water. Precipitation of calcite (calcium carbonate) and gypsum (hydrous calcium sulfate, also known as plaster of Paris) was inferred to explain the fact that calcium and sulfate did not increase as much as chloride between some samples. Dissolution of halite was suggested to account for much higher concentrations of sodium and chloride than of calcium, magnesium, bicarbonate, and sulfate in the 2 samples with the highest TDS concentrations (Lico, 1992, p. 47). Those 2 samples also had unusually high potassium concentrations of 770 and 1,300 mg/L that could be due to the dissolution of sylvite (potassium chloride) (Lico, 1992, p. 47). Sylvite is one of the last minerals to precipitate from evaporating water and is much less common than halite.
Newlands Shallow Ground Water – top
If chloride is not increasing in ground water solely due to evaporation, sulfate might offer a better measure of the degree of evaporation. The graph of TDS and Sulfate Concentrations in Carson Desert Ground Water shows that it doesn’t. Most of the wells less than 12 m deep have a linear trend but a cluster of 3 plots above, or to the left of, it. The high-TDS-type waters have a linear trend but it is not as tight as for TDS and chloride. Several of the samples with specific conductance but not TDS data plot well off any linear trend. The 6 samples with less than 10 mg/L sulfate and more than 2,000 mg/L TDS cannot have evolved from Carson-Truckee river water by evaporation alone. The low sulfate concentrations are most likely due to the precipitation of gypsum, as suggested by Lico (1992).
CR below LD – Carson River below Lahontan Dam
See text for definitions of carbonate, geothermal, and high-TDS water types.
Unclassified samples are categorized by well depths of less than 12 m (39′) or 12-40 m (39-131′).
TDS 2nd drinking water – The U.S. Environmental Protection Agency’s secondary TDS standard for drinking water is 500 mg/L.
SO4 2nd drinking water – The U.S. Environmental Protection Agency’s secondary sulfate standard for drinking water is 250 mg/L.
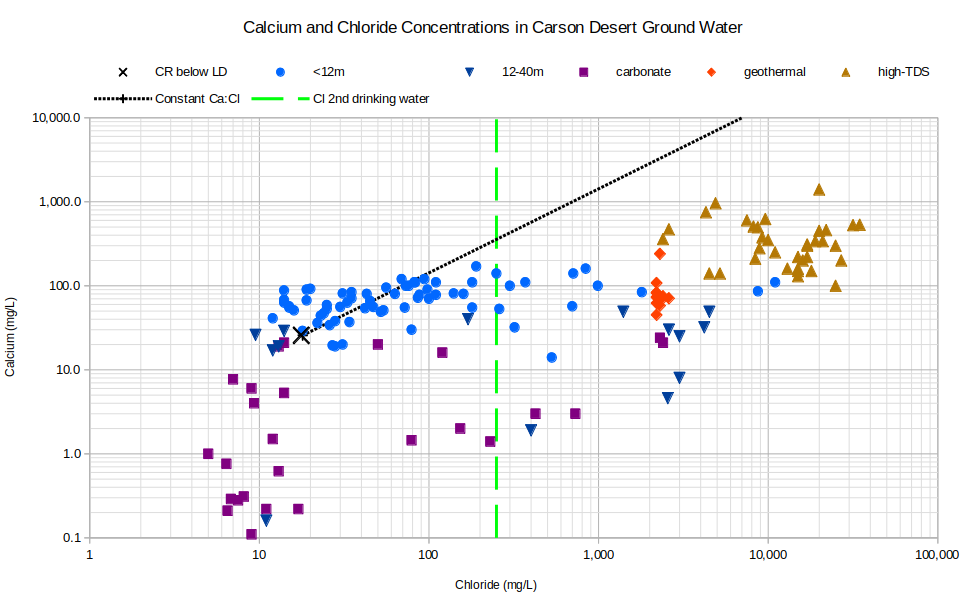
The graph of Calcium and Chloride Concentrations in Carson Desert Ground Water adds support to the inference that calcite and gypsum precipitation affect ground water concentrations. The samples do not follow the constant calcium to chloride ratio line as they would if concentrations were controlled by evaporation. Many samples have more than a factor of 10 less calcium than the constant ratio line. High carbonate concentrations in carbonate-type waters mean that essentially all the calcium can be removed as calcite (calcium carbonate) and some dissolved carbonate will be left over. The somewhat horizontal trend for waters from wells less than 12 m deep suggests that calcium concentrations are buffered by calcite precipitation and dissolution to a range of 20-200 mg/L when the waters have minimal carbonate concentrations. Gypsum precipitation, as inferred from the graph of sulfate versus chloride, contributes to the calcium depletion.
Carbonate waters invariably have magnesium concentrations less than that in Carson-Truckee river water. Magnesium could have been removed as dolomite, which is a calcium-magnesium carbonate. Dolomite precipitates from evaporating seawater in coastal sabkha environments. Morrison (1964) did not mention dolomite in Lake Lahontan sediments.
CR below LD – Carson River below Lahontan Dam
See text for definitions of carbonate, geothermal, and high-TDS water types.
Unclassified samples are categorized by well depths of less than 12 m (39′) or 12-40 m (39-131′).
Cl 2nd drinking water – The U.S. Environmental Protection Agency’s secondary chloride standard for drinking water is 250 mg/L.
Newlands Shallow Ground Water – top
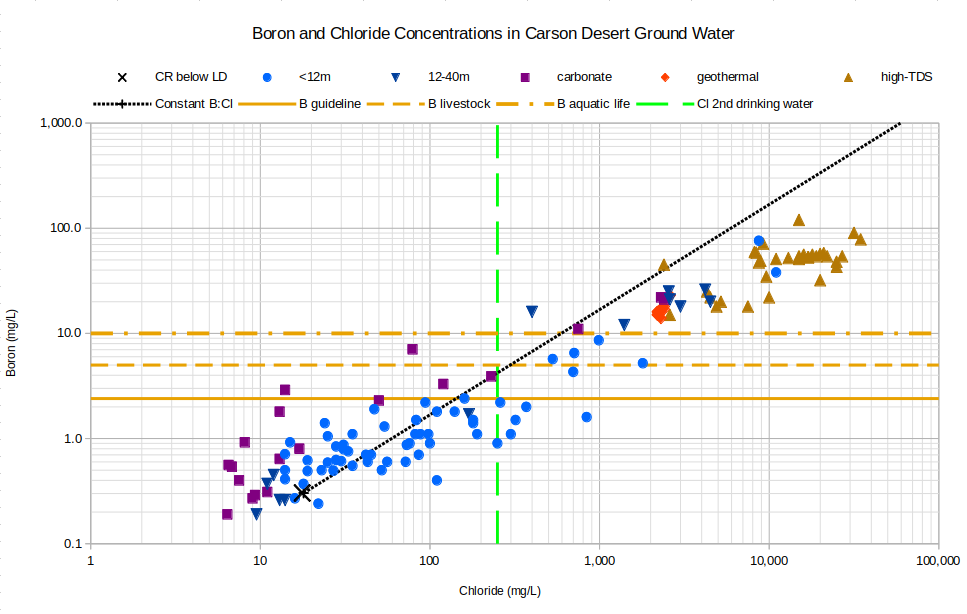
Boron concentrations generally show a stronger control by evaporation than other trace elements, except possibly molybdenum. Ground water samples on the graph of Boron and Chloride Concentrations in Carson Desert Ground Water sort of follow the constant boron to chloride concentration line but the trend drifts off to higher chloride concentrations to the right of the line. This could be due to the gain of chloride from halite dissolution. All high-TDS waters, all geothermal waters, some 12-40 m waters, and a few carbonate waters have levels of boron that are concerning for drinking water, aquatic life, and livestock.
CR below LD – Carson River below Lahontan Dam
See text for definitions of carbonate, geothermal, and high-TDS water types.
Unclassified samples are categorized by well depths of less than 12 m (39′) or 12-40 m (39-131′).
Cl 2nd drinking water – The U.S. Environmental Protection Agency’s secondary chloride standard for drinking water is 250 mg/L.
B aquatic life – Aquatic life criteria for adverse effects in sensitive aquatic animals (Eisler, 1990, p. 27).
B guideline – The World Health Organization has established a “guideline value” of 2.4 mg/L for boron in drinking water. “Short- and long-term oral exposures to boric acid or borax in laboratory animals have demonstrated that the male reproductive tract is a consistent target of toxicity” (Guidelines for Drinking Water Quality, Chemical Fact Sheets, p. 323-324).
B livestock – In Nevada’s “standards for toxic materials” (NAC 445A.1236), the “watering of livestock” standard for boron is 5 mg/L. Health Canada has established a “maximum acceptable concentration” of 5 mg/L boron in drinking water. According to Health Canada, the human “health-based value” is 0.1 mg/L but 5 mg/L is acceptable because small drinking water systems probably cannot achieve lower concentrations using affordable treatment technologies.
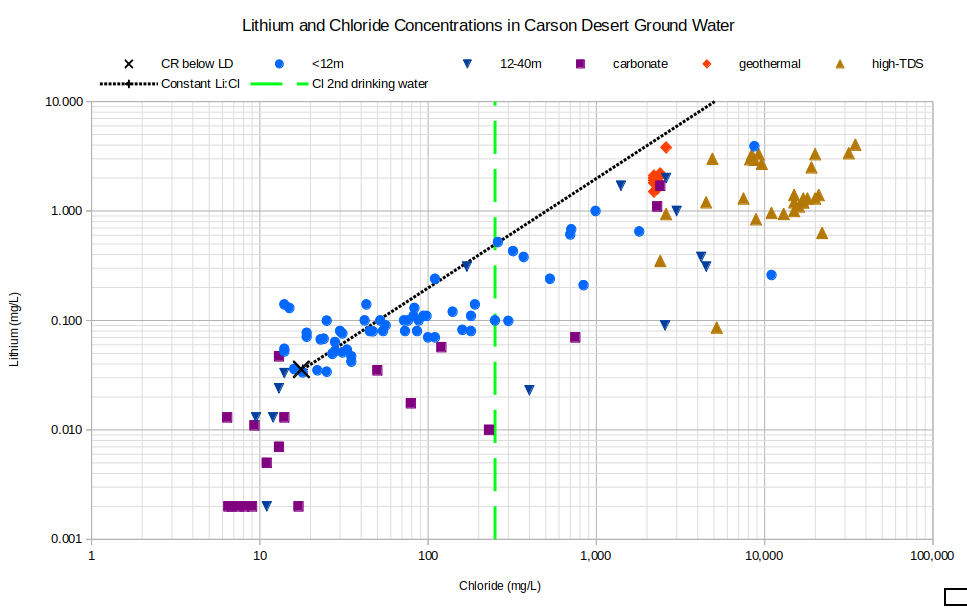
Lithium concentrations show a different relation to chloride than boron. As shown on the graph of Lithium and Chloride Concentrations in Carson Desert Ground Water, most of the lithium concentrations are well below the line of constant lithium to chloride ratio. Some of the carbonate waters have lithium concentrations below the limit of detection and are plotted with concentrations of 0.002 mg/L. Lithium concentrations below the constant ratio line could be due to the formation of lithium-bearing clay, like that which will be mined at the Thacker Pass Mine (BLM permit approved in 2023), and has been identified on various other lithium exploration properties in Nevada. Lico (1992, p. 38-39) suggested that lithium is incorporated into clay minerals in the Stillwater Wildlife Management Area.
CR below LD – Carson River below Lahontan Dam
See text for definitions of carbonate, geothermal, and high-TDS water types.
Unclassified samples are categorized by well depths of less than 12 m (39′) or 12-40 m (39-131′).
Cl 2nd drinking water – The U.S. Environmental Protection Agency’s secondary chloride standard for drinking water is 250 mg/L.
Newlands Shallow Ground Water – top
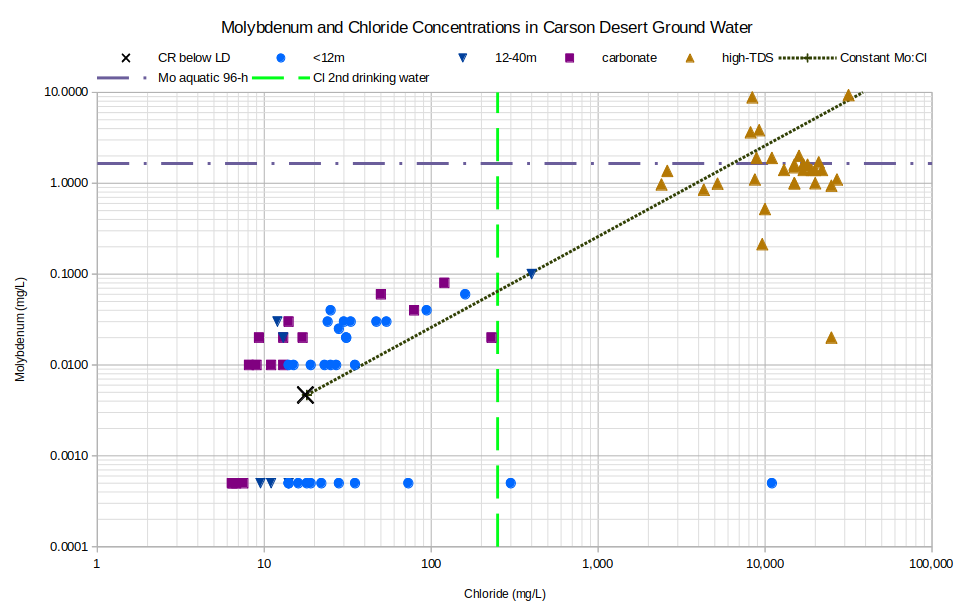
The graph of Molybdenum and Chloride Concentrations in Carson Desert Ground Water indicates strong evaporative enrichment of molybdenum but with significant scatter. The interpretation is hampered by many samples having concentrations below the detection limits (i.e, all samples plotting at 0.0005 mg/L). Greater precision might have resulted in a more symmetrical distribution of results rather than the gap from 0.01 to 0.005 mg/L.
Among the high-TDS waters, all but 3 of the samples have molybdenum enriched by a factor of at least 100 compared to the Carson River below Lahontan Dam. The scatter of high-TDS samples away from the constant ratio line could be partly due to different initial concentrations. 7 analyses of 1987-1988 samples of the Carson-Truckee water below Lahontan Dam ranged from 0.001 to 0.015 mg/L molybdenum. A similar factor of 15 difference would also encompass the high-TDS samples ranging from 0.8 to 10 mg/L molybdenum. A few of the high-TDS samples exceeded Nevada’s aquatic life criterion for molybdenum.
CR below LD – Carson River below Lahontan Dam
See text for definitions of carbonate, geothermal, and high-TDS water types.
Unclassified samples are categorized by well depths of less than 12 m (39′) or 12-40 m (39-131′).
Mo aquatic 96-h – Nevada’s aquatic life criterion for molybdenum averaged over 30 days is 1.65 mg/L (NAC 445A:1236).
Cl 2nd drinking water – The U.S. Environmental Protection Agency’s secondary chloride standard for drinking water is 250 mg/L.
The graph of Arsenic and Chloride Concentrations in Carson Desert Ground Water is reminiscent of a shotgun pattern. Evaporation could account for some increase in arsenic concentrations in some samples but processes of precipitation-dissolution and adsorption-desorption are also responsible. Lico (1992, p. 35) found that approximately 85% of the arsenic in his samples of Lahontan Valley group sediments was present in iron oxide and iron hydroxide coatings of mineral grains. These coatings form when soluble ferric iron (+2 charge) is oxidized to ferrous iron (+3 charge) by oxygen in the water. Precipitation of arsenate minerals from oxygen-rich surface water is also possible.
CR below LD – Carson River below Lahontan Dam
See text for definitions of carbonate, geothermal, and high-TDS water types.
Unclassified samples are categorized by well depths of less than 12 m (39′) or 12-40 m (39-131′).
As drinking water – The U.S. Environmental Protection Agency’s maximum contaminant level for arsenic in drinking water is 0.010 mg/L.
As freshwater CCC – The U.S. Environmental Protection Agency’s freshwater Criterion Continuous Concentration for aquatic life is 0.15 mg/L.
Cl 2nd drinking water – The U.S. Environmental Protection Agency’s secondary chloride standard for drinking water is 250 mg/L.
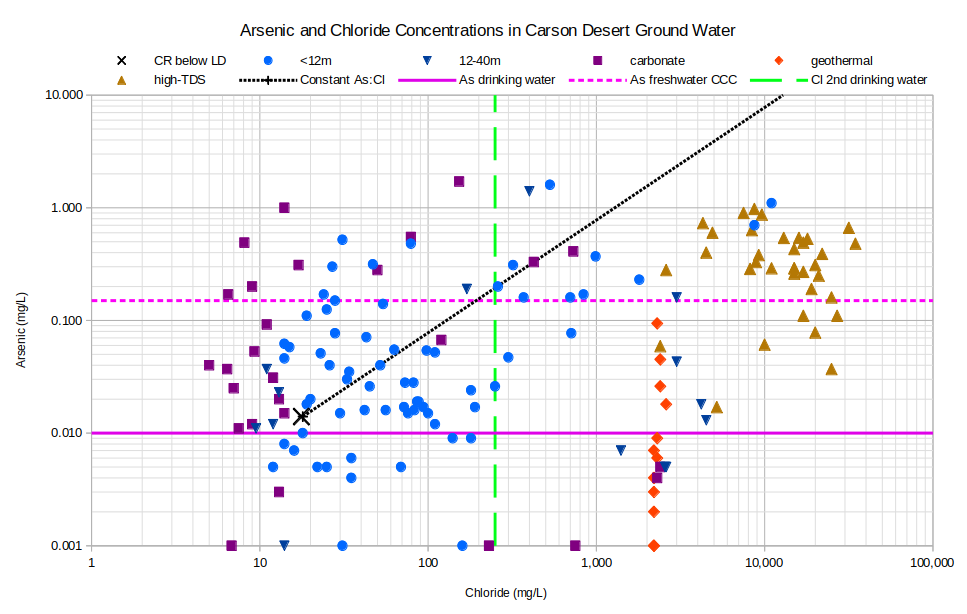
Conversely, decomposition of organic matter on the bottoms of lakes and drains uses up the oxygen in the water and could cause the release of arsenic. Bacteria in the organic matter reduce sulfate to sulfide. This allows the formation of iron sulfide coatings, which also adsorb arsenic, but to a lesser extent than iron oxide-hydroxides. Approximately 60% of the arsenic in Lico’s (1992, p. 35) lake and drain bottom sediments was present in surface coatings consisting primarily of iron sulfide. The lack of correlation between arsenic concentrations and dissolved oxygen concentrations (-0.118, n=71 with 38 below detection limit results replaced by 0.5 mg/L) and Eh (0.061, n=71) suggests competing iron sulfide and iron oxide coatings and arsenates have scrambled the narrative. The graph itself suggests a threshold of about 1.0 mg/L above which arsenic would be adsorbed or precipitated in one form or another, regardless of water type or degree of evaporation.
Most samples have arsenic concentrations too high for humans to safely drink and many are above the U.S. Environmental Protection Agency’s aquatic life criterion for chronic exposure. In this case, high-TDS waters do not have a monopoly on unhealthy concentrations.
Newlands Shallow Ground Water – top
The uranium data set has 2 clusters for unclassified waters from shallow wells and for high-TDS waters. For the several samples that have less uranium than Carson-Truckee river water, uranium must have been adsorbed on or precipitated in a mineral or organic matter. For the many samples from shallow wells that plot above the constant ratio line, uranium bearing minerals, mineral coatings, or organic matter must have been dissolved. Like arsenic, the solubility of uranium changes with its oxidation state, as +4 or +6, such that oxygen-rich water can have higher concentrations of uranium than reduced water. Also like arsenic, correlations with oxygen (-0.003, n=66 with 23 below detection limit results replaced by 0.5 mg/L) and Eh (0.095, n=66) are negligible. In the high-TDS-type samples, uranium seems to have been lost due to precipitation rather than gained although not as much as arsenic was.
CR below LD – Carson River below Lahontan Dam
See text for definitions of carbonate, geothermal, and high-TDS water types.
Unclassified samples are categorized by well depths of less than 12 m (39′) or 12-40 m (39-131′).
U drinking water – The U.S. Environmental Protection Agency’s maximum contaminant level for uranium in drinking water is 0.030 mg/L.
Cl 2nd drinking water – The U.S. Environmental Protection Agency’s secondary chloride standard for drinking water is 250 mg/L.
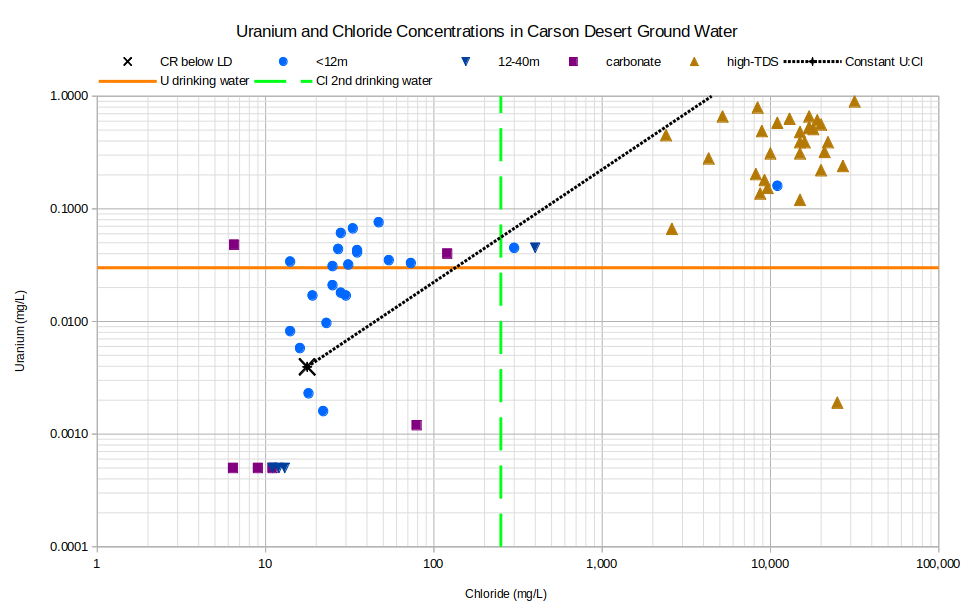
Many samples of Carson Desert ground water with detectable uranium have concentrations greater than the U.S. Environmental Protection Agency’s primary standard for drinking water. Aquatic life criteria have not been established.
Like arsenic and uranium, selenium has multiple oxidation states that are involved in oxidation-reduction reactions. On the graph of Selenium and Chloride Concentrations in Carson Desert Ground Water, too many samples have selenium concentrations below the detection limits (i.e., all samples plotting at 0.0005 mg/L) to confidently identify trends but the correlation with chloride is definitely poor. Although mineral-water reactions have prevented selenium from being enriched as much as would be expected from evaporation, about 40% of samples have concentrations greater than Nevada’s aquatic life criterion.
CR below LD – Carson River below Lahontan Dam
See text for definitions of carbonate, geothermal, and high-TDS water types.
Unclassified samples are categorized by well depths of less than 12 m (39′) or 12-40 m (39-131′).
Se drinking water – The U.S. Environmental Protection Agency’s maximum contaminant level for selenium in drinking water is. Nevada’s “watering of livestock” standard for boron in “standards for toxic materials” (NAC 445A.1236) is also 0.050 mg/L.
Se aquatic 30-d – Nevada’s aquatic life criterion for selenium in standing water averaged over 30 days is 0.0019 mg/L (NAC 445A:1237).
Cl 2nd drinking water – The U.S. Environmental Protection Agency’s secondary chloride standard for drinking water is 250 mg/L.
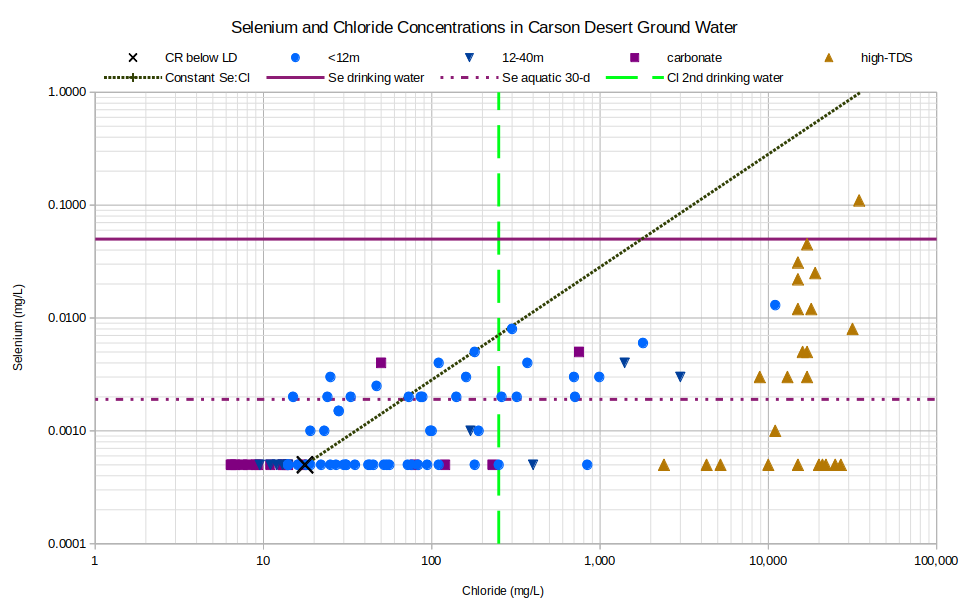
As an example of oxidation-reduction control of selenium concentrations, selenium increased from less than 0.0002 mg/L in “South Lead Lake” water in Stillwater National Wildlife Refuge to 0.012 mg/L in pore water below the lake at a depth of 4-6 cm (1.6-2.4″) (Rowe and others, 1991, Table 7, p. 30). This was caused by a change from oxygen-rich to oxygen-poor conditions as indicated by a dramatic decrease in sulfate concentration and an increase in sulfide concentration along with a change from positive to negative Eh. Sulfate-reducing bacteria were likely present in the organic matter at the bottom of the lake. Such reducing conditions are largely limited to lake bottoms. Of Whitney’s (1994) samples that were analyzed for sulfide, 44 had sulfide concentrations of less than 0.05 mg/L. 3 had measurable sulfide concentrations of 0.02, 0.55, and 0.88 mg/L. The “South Lead Lake” pore fluid had sulfide concentrations of 21, 12, 84, and 81 mg/L at 0-2 cm (0-0.8″), 2-4 cm (0.8-1.6″), 4-6 cm (1.6-2.4″), and 6-8 cm (2.4-3.1″), respectively.
Newlands Shallow Ground Water – top
Shallow ground water under the Carson Desert commonly exceeded secondary drinking water standards for TDS, chloride, and sulfate; primary drinking water standards for arsenic and uranium; and the World Health Organization guideline for boron. Only 1 sample had a concentration greater than the primary drinking water standard for selenium but several had concentrations above Nevada’s aquatic life criterion for standing water. Molybdenum concentrations of a few samples were greater than the aquatic life criterion. Lithium concentrations of some water samples may be harmful but I could find no standards by which to judge that.
Very wide ranges in concentrations of major and trace elements in shallow ground water of the Carson Desert are largely the result of evaporation but other processes are dominant for some dissolved solutes. The longer the duration of surface ponding and residence time in the evapotranspiration zone, the greater the evaporative enrichment of all solutes. Of the solutes reviewed here, boron and molybdenum have the best correlations with chloride. Precipitation of calcite, gypsum, and possibly dolomite, and formation of lithium-bearing clay have reduced calcium, sulfate, lithium, and magnesium concentrations in carbonate-type waters and in waters from wells deeper than 12 m (39′) to less than or barely above those in samples of Carson-Truckee river water and to lesser extents in some other waters. Arsenic, uranium, and selenium concentrations are controlled by oxidation-reduction and adsorption-desorption reactions to the extent that they are rarely enriched by more than a factor of 100 compared to Carson-Truckee water. Arsenic has a particularly poor correlation with chloride.
The high-TDS water type seems to have developed by extreme evaporation. Median concentrations are greater than average Carson-Truckee water by factors of 850 for chloride, 330 for sodium, 300 for molybdenum, 170 for boron, 160 for TDS, 100 for uranium, 40 for lithium, and 20 for arsenic. The high chloride and sodium enrichments are strong evidence for the dissolution of halite in these waters. The wide range of enrichment factors is a result of the complex interplay of evaporation and mineral-water reactions in controlling the shallow ground water chemistry of the Carson Desert.
Mercury contamination in the Carson River Mercury Superfund Site has had minimal, if any, affect on shallow ground water.
High tritium concentrations in shallow ground water indicate that it is all, or mostly, Newlands irrigation water. Its water quality is thus a consequence of Newlands irrigation practices.
Newlands Shallow Ground Water – top