Drains receive farm run-off and shallow ground water. Both those sources are derived from water released from “Lahontan Reservoir”. Drains are the overwhelming source of supply for the ponds and marshes in “Carson Lake and Pasture”. Drain water chemistry evolves as it travels from “Lahontan Reservoir” to “Carson Lake”.
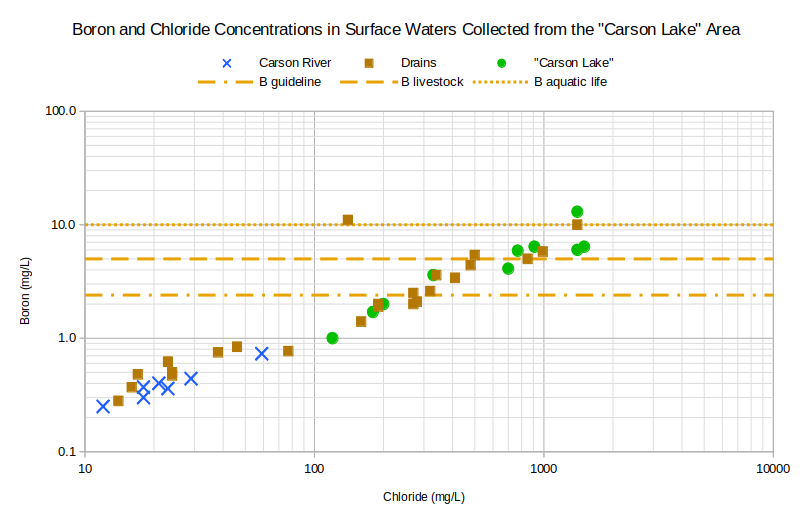
The graph of Boron and Chloride Concentrations in Surface Waters Collected from the “Carson Lake” Area shows water evolution dominated by evaporation. Boron and chloride in common surface waters are generally not affected by mineral-water reactions so their concentrations increase rather steadily as drain water, or its sources, evaporates and there is a good correlation between the 2. A plot of boron versus chloride was also shown on the page for shallow ground water. The point here is to illustrate the evolution of Carson-Truckee river water to drain water and then to lake water at “Carson Lake”. There is considerable overlap of the different types of surface water. Part of the overlap is due to sample collection at different times of year but the general trend is for lake water to have higher concentrations than drain water and river water.
B guideline – The World Health Organization has established a “guideline value” of 2.4 mg/L for boron in drinking water. “Short- and long-term oral exposures to boric acid or borax in laboratory animals have demonstrated that the male reproductive tract is a consistent target of toxicity” (Guidelines for Drinking Water Quality, Chemical Fact Sheets, p. 323-324).
B livestock – In Nevada’s “standards for toxic materials” (NAC 445A.1236), the “watering of livestock” standard for boron is 5 mg/L. Health Canada has established a “maximum acceptable concentration” of 5 mg/L boron in drinking water. According to Health Canada, the human “health-based value” is 0.1 mg/L but 5 mg/L is acceptable because small drinking water systems probably cannot achieve lower concentrations using affordable treatment technologies.
B aquatic life – Aquatic life criteria for adverse effects in sensitive aquatic animals (Eisler, 1990, p. 27).
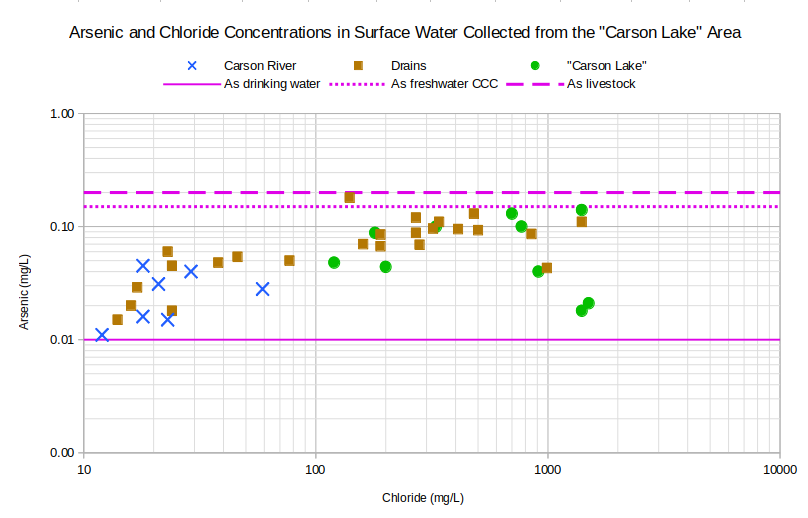
Arsenic is a different story (see graph of Arsenic and Chloride Concentrations in Surface Waters Collected from the “Carson Lake” Area). There is a poor correlation between arsenic and chloride. Arsenic varies from only about 0.01 mg/L to 0.20 mg/L, a factor of 20, while chloride varies from 12 to 1,700 mg/L, a factor of 140. Arsenic concentrations increase due to evaporation, like boron, because the sun shines but mineral-water reactions are removing enough arsenic from solution to offset the effects of evaporation. In the case of the 2 lake samples plotting at about 0.02 mg/L, arsenic concentrations are even less than in some samples of Carson-Truckee river water.
As drinking water – The U.S. Environmental Protection Agency’s maximum contaminant level for arsenic in drinking water is 0.010 mg/L.
As freshwater CCC – The U.S. Environmental Protection Agency’s freshwater Criterion Continuous Concentration for aquatic life is 0.15 mg/L.
As livestock – In Nevada’s “standards for toxic materials” (NAC 445A.1236), the “watering of livestock” standard for arsenic is 0.20 mg/L.
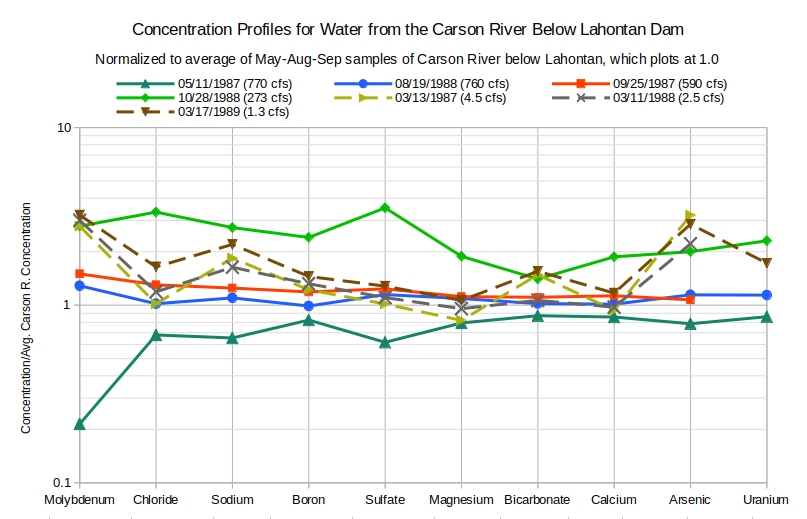
To illustrate how drain water differs from “Lahontan Reservoir” water, concentrations of molybdenum, chloride, sodium, boron, sulfate, magnesium, bicarbonate, calcium, arsenic, and uranium in the drain water are divided by the average of the May 1987, August 1988, and September 1987 concentrations of the Carson River below Lahontan Dam. The advantage of doing this is that concentrations in drain waters that differ from those in Carson River water only by increases due to evaporation will have horizontal profiles above the line equal to 1.0. In the absence of other processes, the distance of the profile above 1.0 would be proportional to the degree of evaporation.
The unitless values of the concentration profiles are best displayed on a logarithmic axis so that an increase in a drain water concentration compared to Carson River water by a factor of 2 looks the same as a decrease in concentration by a factor of 2. That is, the distance on the graph from 1.0 to 2.0 is the same as the distance from 1.0 to 0.5. The distance is also the same for a factor of 2 increase from 5.0 to 10.0, which is helpful when comparing drain waters.
Absolute concentrations cannot be inferred from the graphs. A value for solute A that plots higher than the value for solute B does not mean the drain water has a higher concentration of solute A than solute B. It means that the concentration of solute A has increased more relative to the Carson-Truckee river water than the concentration of solute B did.
The order of the solutes for plotting has been chosen so that drain and “Carson Lake” waters generally plot as smoothly sloping lines. Arsenic and uranium data are plotted at the right end of the profiles because they are noisier. Molybdenum is plotted at the left end because the ground water data suggest it is the trace element least affected by mineral-water reactions and, consequently, it is the most direct measure of evaporation.
As shown on the graph of Concentration Profiles for Water from the Carson River Below Lahontan Dam, concentrations in “Lahontan Reservoir” change with the seasons and flow rates but generally not by more than a factor of 3. Most concentrations are higher in the March samples than in the irrigation- season average. Magnesium is an exception. Molybdenum and arsenic concentrations are at least a factor of 2 higher. This is probably due to ground water with higher molybdenum and arsenic concentrations seeping into the river channel during low-flow periods.
Concentrations have been normalized by dividing by average irrigation-season concentrations of Carson River water collected below Lahontan Dam.
cfs stands for cubic feet per second; 1 cfs is equivalent to 28.3 liters per second, 449 gallons per minute, and 1.98 acre-feet/day.
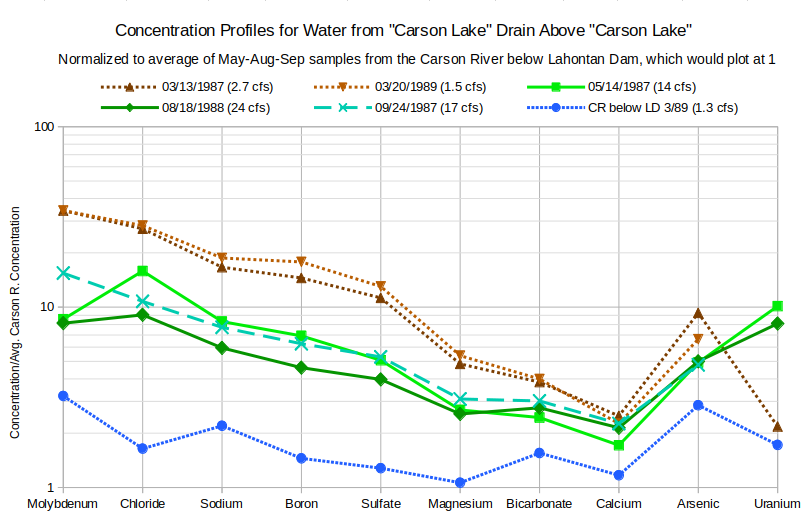
On the graph of Concentration Profiles for Water from L Drain above Lee Drain, north of “Carson Lake”, irrigation season concentrations in the L Drain above the Lee Drain are close to those of water below Lahontan Dam, which would plot at 1.0, but March concentrations are 2.4 to 23 times greater. During the irrigation season, higher flow rates and lower concentrations are likely due to the dominance of minimally evaporated farm run-off waters. During March, there is no farm run-off. The flow must come from ground water. If the March drain water were simply evaporated Carson-Truckee river water, the concentrations for all solutes would plot as a horizontal line at a distance above 1.0 that reflects the degree of evaporation. The March profiles are sloping instead. Most notably, magnesium, bicarbonate, and calcium enrichments are less than those for the other solutes. The profiles suggest something else is going on. One explanation is the precipitation of calcite and possibly dolomite, as discussed on the Newlands Shallow Ground Water page.
Concentrations have been normalized by dividing by average irrigation-season concentrations of Carson River water collected below Lahontan Dam.
cfs stands for cubic feet per second; 1 cfs is equivalent to 28.3 liters per second, 449 gallons per minute, and 1.98 acre-feet/day.
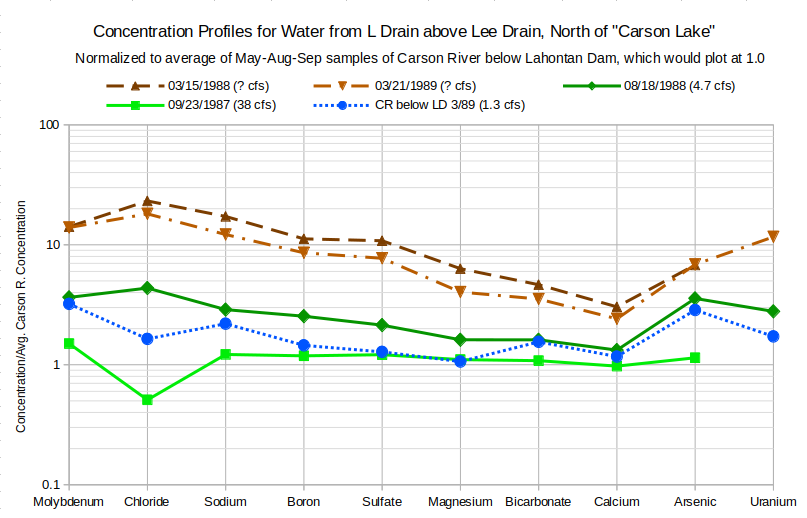
The 2 March samples and the August sample from L Drain above the Lee Drain have small chloride peaks. For the March 1988 sample, the molybdenum concentration is 14 times greater than the irrigation season average of water below Lahontan Dam and the chloride concentration is 23 times greater. Halite dissolution is a possibility. The graph of sodium versus chloride on the Newlands Shallow Ground Water page provides evidence for the dissolution of halite (sodium chloride) in the high-TDS ground water type. The high-TDS water type generally has TDS greater than 10,000 mg/L and chloride greater than 2,500 mg/L. The March 1988 sample has 1,980 mg/L TDS and 410 mg/L chloride. If the ground water comprising the March 1988 drain water sample were affected by halite dissolution, then the sodium concentration would increase too. However, the sodium concentration in the drain water is only 17 times greater than that in water below Lahontan Dam.
It turns out that sodium enrichment, by weight, less than chloride enrichment is consistent with the halite dissolution hypothesis. Halite has equal moles of sodium and chlorine. The formula is NaCl. Although equal moles are released into the water by halite dissolution, equal weights are not. Sodium has a lower atomic weight than chlorine so the weight per liter gain of sodium is less than that of chloride. Assuming the enrichment of 14.14 times for molybdenum in the March 1988 sample is due to evaporation, chloride and sodium concentrations would be expected to increase to 249.8 mg/L and 476.0 mg/L, respectively. Chloride concentration actually increased to 410 mg/L, leaving 160.2 mg, or 0.004519 moles, as possibly due to halite dissolution. 0.004519 moles of sodium weigh 103.9 mg. Evaporative enrichment of 14.14 times and 0.004519 moles of halite dissolution would result in a sodium concentration of 580.0 mg/L. The actual sodium concentration in the March 1988 sample is 580.0 mg/L. Halite dissolution can evidently occur even in ground water with relatively moderate TDS. Other drain waters with chloride peaks may also have been affected by halite dissolution, as long as their molybdenum concentrations have not been affected by water-sediment reactions and faithfully represent the degree of evaporative enrichment.
The concentration profiles for “Carson Lake” Drain, which is at the northwest edge of the “Carson Lake and Pasture” wetlands, have similarities to profiles of the L Drain above Lee Drain. The profiles slope downward from molybdenum to calcium and then rise again through arsenic. Like L Drain above Lee Drain, uranium enrichments are greater than those for arsenic in the May 1987 and August 1988 samples but not in the March 1987 sample. This could be due to a decimal point transcription error. If the uranium concentration of 0.0086 mg/L were changed to 0.086 mg/L, the arsenic-uranium segment of the March 1987 profile would be parallel to those for May 1987 and August 1988.
The March samples from “Carson Lake” Drain don’t have chloride peaks but the May 1987 and August 1988 do. The most likely reason is dissolution of halite as in the waters of L Drain above Lee Drain. This interpretation assumes that halite has been precipitated below the surface where it cannot be dissolved by farm run-off.
The seasonal differences between the “Carson Lake” Drain profiles demonstrate that the mixtures of ground waters entering drains change from time to time. “Carson Lake” Drain’s irrigation-season profiles are more strongly enriched and more strongly sloping than those of L Drain above Lee Drain. This could be due to a greater proportion of ground water in “Carson Lake” Drain and a greater proportion of farm run-off in L Drain, at least during the years sampled. Differences in ground water concentrations at the 2 locations would be expected but are likely less than differences between average farm run-off and average ground water.
Concentrations have been normalized by dividing by average irrigation-season concentrations of Carson River water collected below Lahontan Dam.
cfs stands for cubic feet per second; 1 cfs is equivalent to 28.3 liters per second, 449 gallons per minute, and 1.98 acre-feet/day.
Since I have written that March drain water samples are ground water, a comparison to ground water from wells is called for. The graph of Concentration Profiles for Water from “Carson Lake” Drain above “Carson Lake” in March and Nearby Wells shows profiles for 3 March profiles and for 2 wells: Carson L.-2B (4.1 m deep, CL-AH-2B in tables, site number 30 on plate 1, of Hoffman and others, 1990) and 15.ofr94-39 (7.3 m deep, site number 15, location of T17N, R29E, section 5, bcbb1, of Whitney, 1994). Solute concentrations in the wells more or less bracket the concentrations of the March drain samples and thus demonstrate that March drain water could be ground water. The graph also demonstrates how much ground water quality can differ from place to place. Drain flow paths from the Carson River below Lahontan Dam to “Carson Lake and Pasture” are more than 15 km (9 miles) long. The chemical compositions of winter drain waters are volume-weighted averages of the various local ground waters seeping into the drains along the flow paths so differences between drain waters is not surprising.
Concentrations have been normalized by dividing by average irrigation-season concentrations of Carson River water collected below Lahontan Dam.
cfs stands for cubic feet per second; 1 cfs is equivalent to 28.3 liters per second, 449 gallons per minute, and 1.98 acre-feet/day.
Well Carson L.-2B (depth 4.1 m, 13.3′) is near the northwest edge of “Carson Lake” wetlands and within about 1 km (0.6 miles) of the “Carson Lake” drain sample site.
Well 15.ofr39-49 (depth 7.3 m, 24′) is northwest of “Carson Lake” within 5 km (3 miles) of the wetlands.
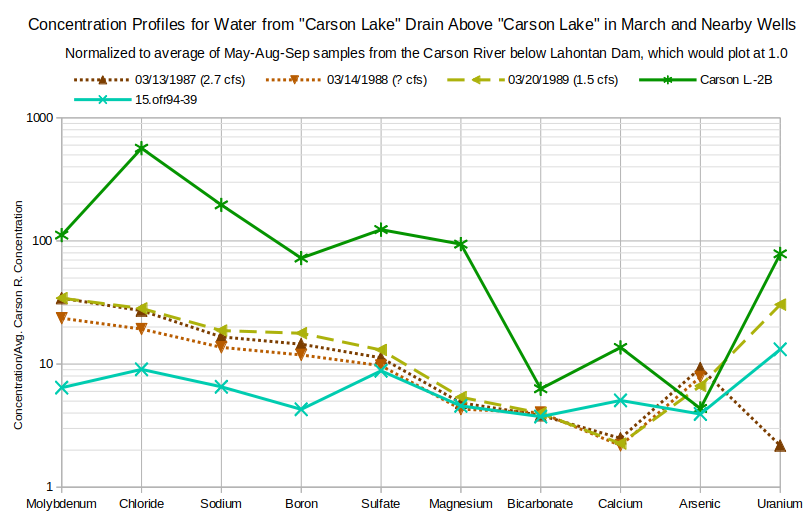
The 2 well profiles are different from the drain profiles and from each other. The 15.ofr94-39 profile matches the enrichments of sulfate, magnesium, and bicarbonate in March drain waters but molybdenum, sodium, chloride, and boron enrichments are less. The 15.ofr94-39 profile is more horizontal than sloping. This suggests concentrations are controlled primarily by evaporative enrichment of Carson-Truckee river water.
The profile for Carson L.-2B shows not only much stronger enrichment but also a steeper slope than that for well 15.ofr94-39 and the March drain waters. The boron trough and calcium peak are stronger than in well 15.ofr94-39 and are quite unlike the March drain waters. The chloride peak and sodium enrichment greater than molybdenum enrichment are strong evidence for halite dissolution in the ground water of well Carson L.-2B even without going through the calculations. Chemical differences between domestic well waters were previously observed by Glancy (1986, p. 46-47): “Water of different chemical composition can be found at similar depths in lateral distances of a few tens of feet or at slightly different depths at the same site.”
To explore the variability of solute concentrations in ground water in the vicinity of “Carson Lake and Pasture”, profiles for 5 wells with moderate TDS concentrations of 900-2,100 mg/L and 5 with high TDS of 14,000-66,000 mg/L (all are high-TDS water type) were graphed. For the moderate-TDS waters, the profiles on the graph of Concentration Profiles for Water from Shallow Wells with Moderate TDS Between “Carson Lake” and Fallon have various patterns. Enrichment factors range from less than 1 to about 20. 3 of the profiles indicate evaporation as the dominant control as they are approximately horizontal from chloride to calcium.
Concentrations have been normalized by dividing by average irrigation-season concentrations of Carson River water collected below Lahontan Dam.
Well 20.ofr94-39 (depth 3.7 m, 12′) is on the west side of US 95 south of Fallon.
Well 19.ofr39-49 (depth 7.3 m, 24′) is on the east side of US 95 south of Fallon.
Well 22.ofr94-39 (depth 4.0 m, 13′) is east of well 20.ofr94-39.
Well 15.ofr39-49 (depth 7.3 m, 24′) is northwest of “Carson Lake” within 5 km (3 miles) of the wetlands.
Well 26.ofr94-39 (depth 4.3 m, 14′) is adjacent to US 95 about 1.7 km (1 mile) south of Fallon.
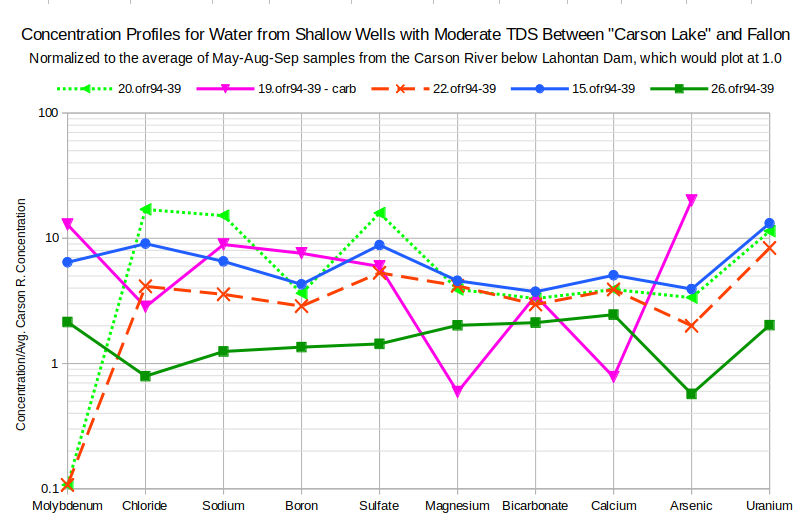
Calcite precipitation has probably affected the ground water in well 20.ofr94-39 as chloride, sodium, and sulfate are enriched over Carson River water by factors of 15-17 times while magnesium, bicarbonate, and calcium are enriched only 3.3 to 3.9 times. Well 19.ofr94-39 has carbonate-type water with a very distinctive profile. Calcium and magnesium concentrations less than in Carson River water were likely caused by precipitation of calcite and possibly dolomite. Bicarbonate was not similarly decreased because abundant carbonate ion provided the carbonate for the precipitation reaction. 19.ofr94-39 water had 19 mg/L carbonate whereas only 1 of 30 domestic well waters analyzed by Fosbury and others (2008) had carbonate concentrations greater than the detection limit of 12 mg/L.
The chloride troughs of 19.ofr94-39 and 26.ofr94-39 are suggestive of the precipitation of halite causing chloride and sodium concentrations to be less than what they would be due to evaporation. However, the numbers don’t work out quite right. The sodium concentration predicted for 19.ofr94-39 assuming the same evaporative enrichment as molybdenum is 318 mg/L whereas the actual concentration was 300 mg/L. For 26.0fr94-39, the predicted sodium concentration is 57 mg/L but the actual was 42 mg/L. The sums of the major ion concentrations in the 2 well waters were 1,072 and 445 mg/L, at least an order of magnitude less than what would be expected for waters precipitating halite. The discrepancies could be due to concentrations in the ultimate Carson-Truckee river source waters different from those of the irrigation-season average based on 3 samples but there is no justification in pressing the point.
Molybdenum enrichments are quite varied. 2 of the samples even have concentrations below the detection limit. There is not a good case for the variations being due to varying concentrations of the Carson-Truckee river sources. 1 of 9 samples of water below Lahontan Dam had a detection limit concentration of 0.001 mg/L molybdenum but none had less than the detection limit. This variation in molybdenum concentrations undermines the use of molybdenum as a measure of evaporative enrichment. Moderate skepticism regarding my chemical interpretations is warranted.
The profiles for high-TDS waters on the graph of Concentration Profiles for Water from Shallow Wells with High TDS near “Carson Lake” or “Harmon Lake” are more consistent than those of the moderate-TDS waters and have distinct differences compared to the moderate-TDS ground waters. Enrichment factors for molybdenum through magnesium are generally 60 or more. There are deep troughs for bicarbonate and calcium due to calcite precipitation. All profiles have chloride peaks indicative of halite dissolution and shallow boron troughs of uncertain origin. The slopes from molybdenum to bicarbonate offer an explanation for similarly sloping drain waters as the result of high-TDS-type ground waters seeping into the drains.
Concentrations have been normalized by dividing by average irrigation-season concentrations of Carson River water collected below Lahontan Dam.
Well Carson L.-2B (depth 4.1 m, 13.3′) is near the northwest edge of “Carson Lake” wetlands and within about 1 km (0.6 miles) of the “Carson Lake” drain sample site.
Well 18.ofr39-49 (depth 4.6 m, 13′) is north of “Carson Lake”.
Avg. 5 CL wells <5m – Averages of 5 wells with depths of 4.6 m (13) in four 3-4 well clusters with different depths less than 1 km (1 mile) apart in the northeastern part of “Carson Lake”.
Well Harmon L.-5A (depth 9.1 m, 30′) about 1.7 km (1 mile) east of “Harmon Lake”, which is about 13 km (7.8 miles) east of Fallon, between New River and Lower Diagonal Drain.
Well Harmon L.-6A (depth 7.6 m, 25′) less than 1 km (0.6 miles) east of Harmon L.-5A and also west of Lower Diagonal Drain.
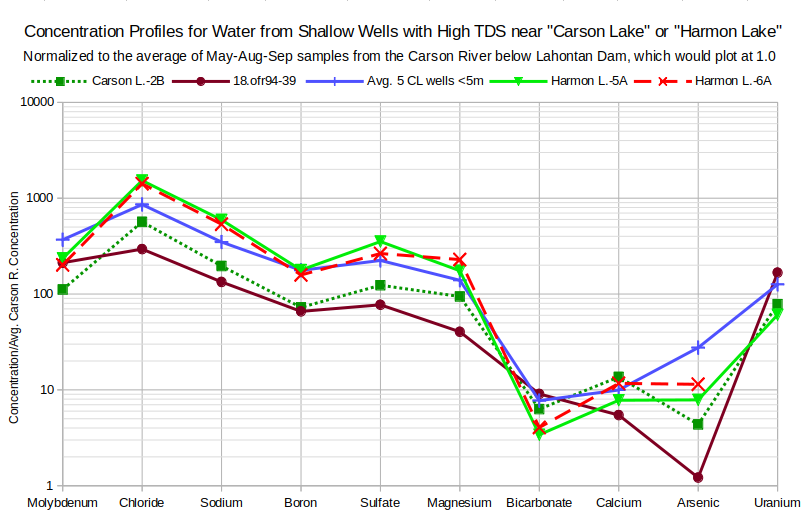
The deviations of the arsenic concentrations in wells 18.ofr94-39 and Carson L.-2B from the common pattern could be due to more decimal point transcription errors. Replacing the 0.017 mg/L concentration with 0.17 mg/L changes the enrichment factor for 18.ofr94-39 to about the same as that of arsenic in water from well Harmon L.-6A and the enrichment factor for Carson L.-2B water to above that for the average of the 5 “Carson Lake” wells. With those changes, the lines from calcium to arsenic for both well profiles would be approximately parallel to each other and to that for Avg. 5 CL wells <5 m.
The graphs of Concentration Profiles for Water from Drains Near “Carson Lake” in March 1989 and Concentration Profiles for Water from Drains Near “Carson Lake” in August 1988 provide further clarity on how ground water seepage controls drain water chemistry. The greatest enrichments for most solutes occur in March, when the drains have only ground water. Steeper slopes from molybdenum to magnesium, like those in high-TDS-type ground water profiles, are associated with greater enrichments. Calcium troughs are also similar to the high-TDS ground water type but bicarbonate enrichments greater than those for magnesium and calcium in the March samples are not. Some of the drain waters have chloride peaks but boron troughs are absent.
CR below LD – Carson River below Lahontan Dam
G-Line – G-Line Extension Drain is a north-south drain 1-2 km (0.6-1.2 miles) west of US 95 but sampled east of US 95 after it turns east to approach the southwest corner of “Carson Lake” (Figure 2, p. 5 of Rowe and others, 1991).
Holmes – Holmes Drain; east-west drain south of Pasture Road, sampled about halfway between US 95 and “Carson Lake” Drain.
L above Lee – L Drain extends south from Upper Diagonal Drain at Fallon Naval Air Station and enters central part of “Carson Lake”, sampled a few hundred meters north of its junction with the East Lee Drain and the West Lee Drain, which, together, ring the northern edge of “Carson Lake”.
Rice – Rice Drain extends south from AA Canal at south edge of Fallon Naval Air Station into east-central part of “Carson Lake” east of L Drain, sampled a few hundred meters south of East Lee Drain.
CL Drain – “Carson Lake” Drain extends south from AA Canal into western part of “Carson Lake”, sampled near junction with Holmes Drain a few hundred meters north of “Carson Lake”.
“Sprig Pond” is a perennial water body in the western part of “Carson Lake”.
Concentrations have been normalized by dividing by average irrigation-season concentrations of Carson River water collected below Lahontan Dam.
cfs stands for cubic feet per second; 1 cfs is equivalent to 28.3 liters per second, 449 gallons per minute, and 1.98 acre-feet/day.
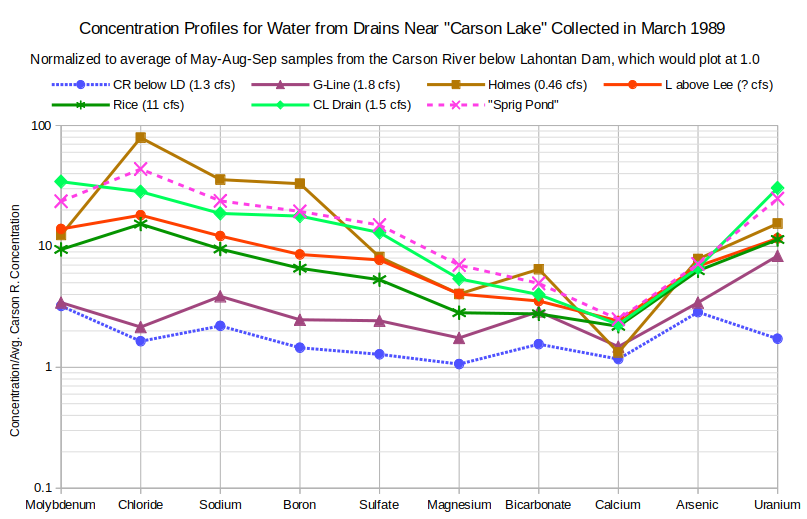
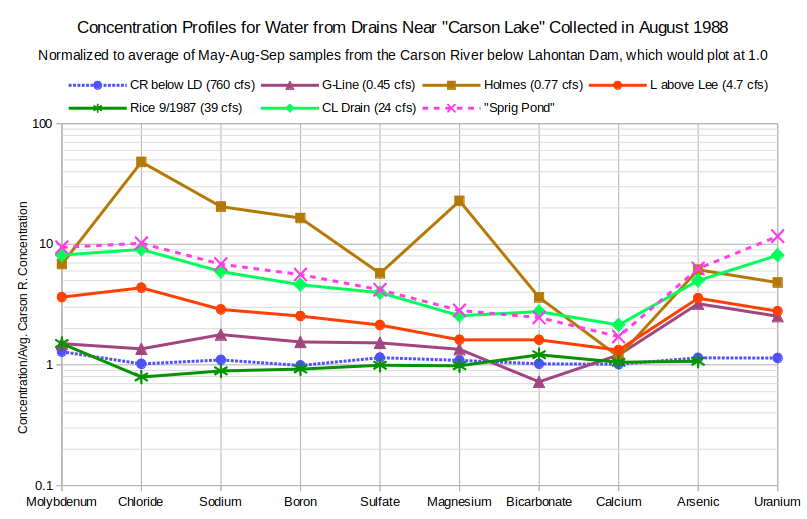
The August concentration profiles have smaller proportions of ground water than the March samples, as indicated by smaller enrichments, flatter slopes, and more subdued calcium troughs and chloride peaks. In fact, the Rice Drain sample plots so close to the Carson River average at 1.0 that it looks like it is being used as a canal with fresh river water. The flow rate of 39 cubic feet per second (1,100 liters per second, 17,500 gallons per minute) is unusually high. Solutes in the G-Line Extension Drain sample are also enriched by less than a factor of 2 compared to river water even though flow rates are quite low.
The relatively horizontal profile of G-Line Extension Drain for March 1989 suggests little, if any, seepage of the high-TDS ground water type. It is more similar to the moderate TDS water in well 15.ofr94-39. G-Line Extension Drain is not in the same area as the other drains. It is west of the South Branch and only crosses to the east side of US 95 at the west edge of “Carson Lake”.
The enrichment of uranium greater than all the other solutes in the G-Line Extension Drain sample is further evidence that mineral-water reactions are important controls on uranium concentrations. Similar to uranium concentrations in L Drain above Lee and Holmes Drain, uranium in G-Line Extension Drain is enriched markedly less in the August sample. It seems that ground water has been flushed out of the drains so that farm run-off can dominate even though flow rates at the time of sampling were less than in March.
The uncharacteristically low uranium enrichment in the profile of the Carson River below Lahontan Dam (CR below LD) may be due to a decimal point transcription error. Changing the reported concentration of 0.007 mg/L uranium to 0.07 mg/L results in the same uranium enrichment as for the Holmes Drain. This makes the arsenic-uranium segment of the Carson River profile a little steeper than the others but more consistent than an enrichment factor below that of arsenic. The May 1987, August 1988, and October 1988 samples have uranium enrichments approximately equal to arsenic enrichments so a uranium enrichment less than arsenic in March 1989 is not out of the question. Uranium concentrations were not measured in March 1987 and March 1988.
There is a remarkable change in the relative enrichments of sulfate and magnesium in the Holmes Drain from August 1988 to March 1989. The August 1988 magnesium enrichment for the Holmes Drain also differs markedly from the other August 1988 samples. Neither a unique occurrence of a soluble magnesium mineral in the proximal part of the August ground water seepage path or a magnesium crop treatment in the farm run-off seem particularly likely. The pronounced magnesium anomaly could be due to a decimal point transcription error. If the August 1988 magnesium concentration is changed from 170 mg/L to 17 mg/L, the August 1988 Holmes Drain magnesium enrichment drops to 2.3, slightly less than that for “Carson Lake” Drain (CL Drain). This gives the August profile a moderate magnesium trough like that of the March profile.
The profile of “Sprig Pond” closely tracks the “Carson Lake” Drain (CL Drain) profiles in March and in August. The “Sprig Pond” sample site is in “Carson Lake” about 1.5 km (0.9 miles) from the “Carson Lake” Drain sample site. It is also close to the entrance of “Carson Lake” Drain into “Carson Lake”. The slightly greater enrichment of all solutes in “Sprig Pond” compared to “Carson Lake” Drain in March and of all but bicarbonate and calcium in August is easily explained by greater evaporation from the pond.
The graph of Concentration Profiles for Water from “Sprig Pond” shows how the chemistry of “Sprig Pond” water changes with the seasons. This mirrors the changes of the profiles for “Carson Lake” Drain. Enrichments compared to Carson-Truckee river water are lowest in the August 1988 sample when inflows are high and highest in the March 1987 sample. The pattern changes from a near linear downward slope from molybdenum to calcium in August 1988 to steeper slopes with chloride peaks in May 1987 and March 1987 and 1989. From the August 1988 profile to the March 1987 profile, solute enrichments change by about 2-7 times.
Concentrations have been normalized by dividing by average irrigation-season concentrations of Carson River water collected below Lahontan Dam.
Well Carson L.-2B (depth 4.1 m, 13.3′) is near the northwest edge of “Carson Lake” wetlands.
Avg. 5 CL wells <5m – Averages of 5 wells with depths of 4.6 m (13) in four 3-4 well clusters with different depths less than 1 km (1 mile) apart in the northeastern part of “Carson Lake”.
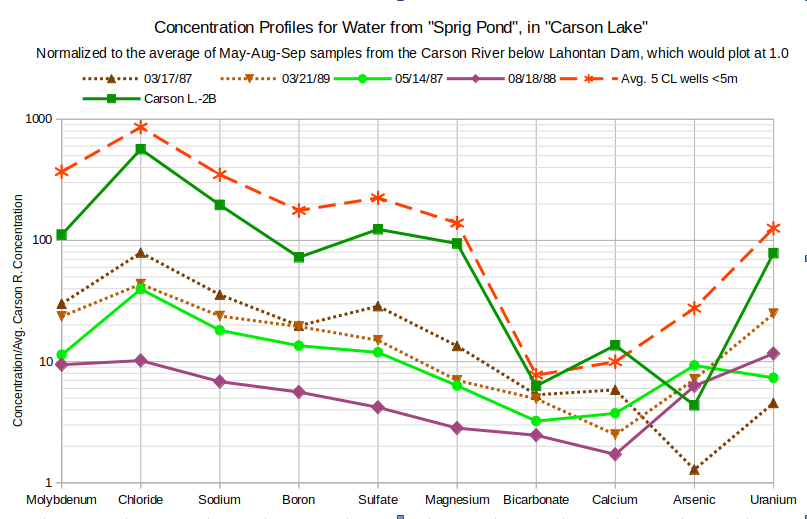
An important question for the water chemistry of “Carson Lake” and how it might be controlled is whether ground water flows into “Carson Lake” or receives recharge from “Carson Lake”. The profiles of ground water samples from a nearby well and from the averages of the shallowest wells in well clusters in the wetlands northeast of “Sprig Pond” are plotted for comparison on the graph of Concentration Profiles for Water from “Sprig Pond”. The profile for well Carson L.-2B was previously compared to those for “Carson Lake” Drain. The quality of ground water under and near “Carson Lake” is much worse even than surface waters of “Carson Lake” and of the drains entering it. All solutes have higher concentrations in ground water than in surface water, more than 3 times higher for molybdenum, chloride, sodium, boron, sulfate, and magnesium in water from well Carson L.-2B compared to “Sprig Pond” March 1987.
For most solutes, the ground water looks like more evaporated, i.e., more enriched, “Sprig Pond” water. The bicarbonate and calcium exceptions can be explained by calcite precipitation. 3 of 4 “Sprig Pond” samples also have chloride peaks. 1 of 4 “Sprig Pond” samples also has a boron trough. Except for 1 of the “Sprig Pond” samples and 1 of the well samples, the profiles show a steep rise from calcium to uranium.
The sharp arsenic troughs in the profiles for Carson L.-2B and March 1987 samples could be due to decimal point transcription errors. Changing 0.018 mg/L to 0.18 mg/L for the March 1987 sample and 0.061 mg/L to 0.61 mg/L for the Carson L.-2B sample makes the calcium to arsenic slopes nearly parallel for all the “Sprig Pond” and well samples.
Does enriching “Sprig Pond” water to make ground water or diluting ground water to make “Sprig Pond” water better fit the data? For typical “Sprig Pond” water, I averaged the 3 March samples of “Sprig Pond”, with replacement of the March 1987 arsenic concentration by 0.18 mg/L. Because “Sprig Pond” receives most of its inflow during the irrigation season and the September 1987 Rice Drain sample indicates nearly pure Carson River water reaches “Carson Lake” at times, I chose the average of May, August, and September Carson River below Lahontan Dam samples as the diluent. I chose the evaporation and dilution factors to match the molybdenum concentration in the well water or the pond water, respectively.
Simple dilution or evaporation doesn’t result in even approximate fits to concentrations of calcium, bicarbonate, arsenic, and uranium. I determined the number of moles of calcite precipitation or dissolution needed as the difference from the molybdenum-based evaporation or dilution. I assumed arsenic was adsorbed or desorbed as needed to fit the arsenic concentration. I similarly assumed uranium was precipitated as carnotite or dissolved as needed. If arsenic were precipitated in some mineral rather than adsorbed and if uranium were adsorbed on organic matter rather than precipitated, it would not change the results or affect the validity of the evaporation or dilution calculations. The uranium and arsenic assumptions are merely used to suggest plausible processes.
The graph of Concentration Profiles for March “Sprig Pond” Water and Diluted “Carson Lake” Well Water shows that dilution of 1 part well water with 14 parts Carson River water is a plausible explanation for the origin of “Sprig Pond” water. Dilution alone (solid red line) simply shifts all the enrichments down from the well enrichments (dashed red line). This results in bicarbonate, calcium, arsenic, and uranium concentrations that are far too low. Dissolution of calcite can add sufficient bicarbonate and calcium in the proper ratio. Arsenic and uranium can be added by appropriate dissolution or desorption. The resulting exact fit to the average of the 3 March “Sprig Pond” samples does not mean the model is correct. Without independent evidence for the magnitudes of calcite, arsenic, and uranium dissolution, I adjusted the parameters to make an exact fit. The calculated result has a slightly lower boron trough and a slightly higher chloride peak than the “Sprig Pond” average.
Concentrations have been normalized by dividing by average irrigation-season concentrations of Carson River water collected below Lahontan Dam.
Avg. 5 CL wells <5m – Averages of 5 wells with depths of 4.6 m (13) in four 3-4 well clusters with different depths less than 1 km (1 mile) apart in the northeastern part of “Carson Lake”.
14x dilution of well water – concentrations were calculated by adding 1 part well water to 14 parts average irrigation-season Carson River water below Lahontan Dam
14x dil.+calcite+ads. As+carnotite – concentrations of bicarbonate and calcium in diluted well water were adjusted for dissolution of 0.00127 moles/liter calcite, desorption of 1.18 x 10exp-6 moles/liter arsenic, and dissolution of 8.87 x 10exp-8 moles/liter uranium in carnotite
“Sprig Pond” March 87,88,89 – average of samples collected from “Sprig Pond” in March of 1987, 1988, and 1989
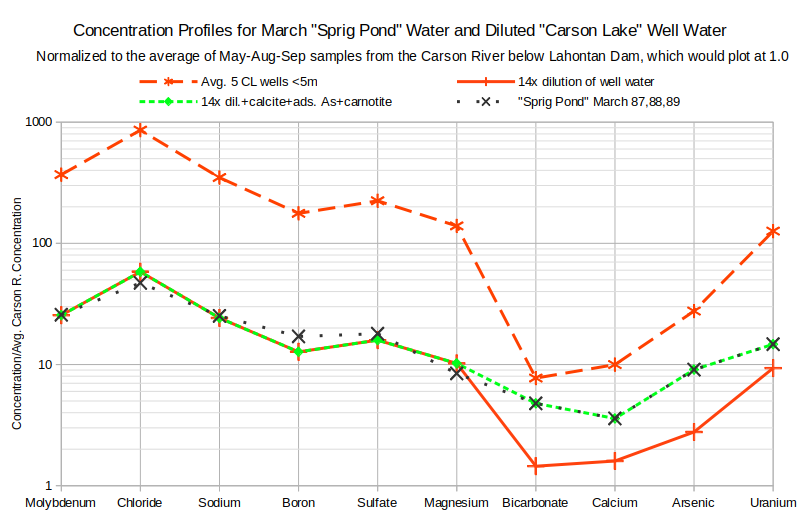
There is an equally good fit for the comparable evaporation scenario. To simulate evaporation, I multiplied all the “Sprig Pond” concentrations by 14. Enrichments of bicarbonate, calcite, arsenic, and uranium were fit by adjusting the parameters for the precipitation of calcite, the adsorption of arsenic, and the precipitation of uranium. I guess I should have known the results would look the same. Unfortunately, that leaves the question open.
There is 1 factor which tips the balance of evidence toward the evaporation scenario. 1 of the well waters analyzed for tritium is of the high-TDS type like the waters in all of the “Carson Lake” wells and had a concentration of 55 picoCuries/liter. That is consistent with irrigation water taking a few decades to percolate down to the water table, drift laterally into a drain, flow down the drain to “Carson Lake”, and then percolate down from an evaporating pond in “Carson Lake”. Older water would open up the possibility of dominantly subsurface flow to “Carson Lake” and favor the dilution scenario.
There is another factor which may tip the balance toward dilution. Well Carson L.-2B is beyond the area of ponding water on “Carson Lake”. It is located about 1.7 km (1 mile) northeast of the wetlands of “Carson Lake and Pasture” on plate 1 of Hoffman and others (1990). Water in the well is of the high-TDS type and, as shown on the graph of Concentration Profiles for Water from “Sprig Pond” in “Carson Lake”, its solute concentrations are similar to those in the “Carson Lake” wells. This suggests a broad area of high-TDS ground water that is not limited to the current area of evaporating “Carson Lake” ponds.
A close look at water levels could reveal whether the high-TDS water under “Carson Lake” flowed vertically downward or laterally from somewhere else. This has important ramifications for water management at “Carson Lake and Pasture”. If the high-TDS water flowed downward from the lake, then the larger the lake area, the larger the volume of high-TDS water. A spreading plume of shallow, high-TDS ground water could have negative consequences for the “Carson Lake and Pasture” ecosystem, particularly if it becomes less shallow over time.
A static water level in wells or piezometers at “Carson Lake” that is close to or above the surface level of the water in the lake would indicate the lack of a downward vertical gradient and preclude downward percolation of pond water. In that case, high-TDS ground water under “Carson Lake” has likely flowed laterally to its current position and not much can be done about it. Conversely, a static water level in wells or piezometers below the surface of the lake would indicate a downward vertical gradient that would allow pond water to flow into the sediments below it and build up over time. Eventually, as more water is directed to “Carson Lake and Pasture” to support more bird habitat, “Carson Lake” could drown in the high-TDS water it created.
The closest wells to “Carson Lake” with water level data that I have found are the Dodge Ranch wells described by Lico and others (1986) and a well at the bend in US 95 reported by Glancy (1986). Glancy’s (1986, Table 9, p. 40, and Figure 17, p. 42) well is in the northeast quarter of the northeast quarter of section 1, Township 16 North, Range 28 East, on the west side of US 95 at the southwest corner of “Carson Lake and Pasture”. The well is 8.2 m (27′) deep and has a depth to water of about 6.4 m (21′). On the map of water table contours in Figure 17, water in the well has an elevation of 1,186 m (3,890′). This is below the water surface elevation of 1,191 m shown on the 1:24,000-scale, 7.5-minute “Carson Lake” quadrangle, which was field checked only a few years before, in 1981. As drawn by Glancy (1986) from sparse data, the 1,186 m water table contour extends from the well northeastward through the middle of “Carson Lake”. If the water level in this well is an accurate measure of the water level under “Carson Lake”, evaporated pond water could account for the high-TDS water under “Carson Lake”.
The Dodge Ranch wells are in the southwest quarter of the northwest quarter of section 6, Township 17 North, Range 28 East (Lico and others, 1986, Table 1, p. 5), approximately 4.6 km (2.8 miles) northwest of the edge of the “Carson Lake” marsh shown on the 7.5-minute “Carson Lake” quadrangle. Water levels were reported in Table 3, p. 17, for 29 wells and piezometers ranging in depth from 1.9 to 8.8 m (6.3-29′). Because water levels rise during the irrigation season, the April 8, 1985 water levels, which are generally the deepest, were chosen for the calculation. The April Dodge Ranch water levels were 5.1-6.4 m above the water level in “Carson Lake” as shown on the 7.5-minute “Carson Lake” quadrangle. The average height of 5.7 m implies a gradient of 0.00122 over the 4.6 km (2.8 miles) to the marsh. This result is permissive of a lateral flow origin for high-TDS water under “Carson Lake” but doesn’t preclude a vertical origin. If “Carson Lake” is perched on a clay layer, then the surface water level is hydraulically disconnected from the regional water table and the implied gradient between Dodge Ranch and the surface water is meaningless. Glancy’s (1986, Figure 17, p. 42) water table contours have a gradient which I measured off at about 0.00143. If the Dodge Ranch water level is projected to “Carson Lake” at Glancy’s (1986) gradient, an unsaturated zone below the lake and a downward vertical gradient are possible. The balance of the weak water level data slightly favors a vertical, evaporation origin for the high-TDS water under “Carson Lake”.
This summary and the previous section on Newlands Shallow Ground Water have demonstrated that the drain waters, surface waters, and shallow ground waters in and upstream of “Carson Lake and Pasture” are of poor quality. Is the water quality poor enough to kill?