The base map is provided by OpenTopoMap’s volunteer servers. The red diagonally ruled areas are Navy bombing ranges and its airfield in Fallon but with pre-2023 boundaries.
Recent History of “Carson Lake” Playa
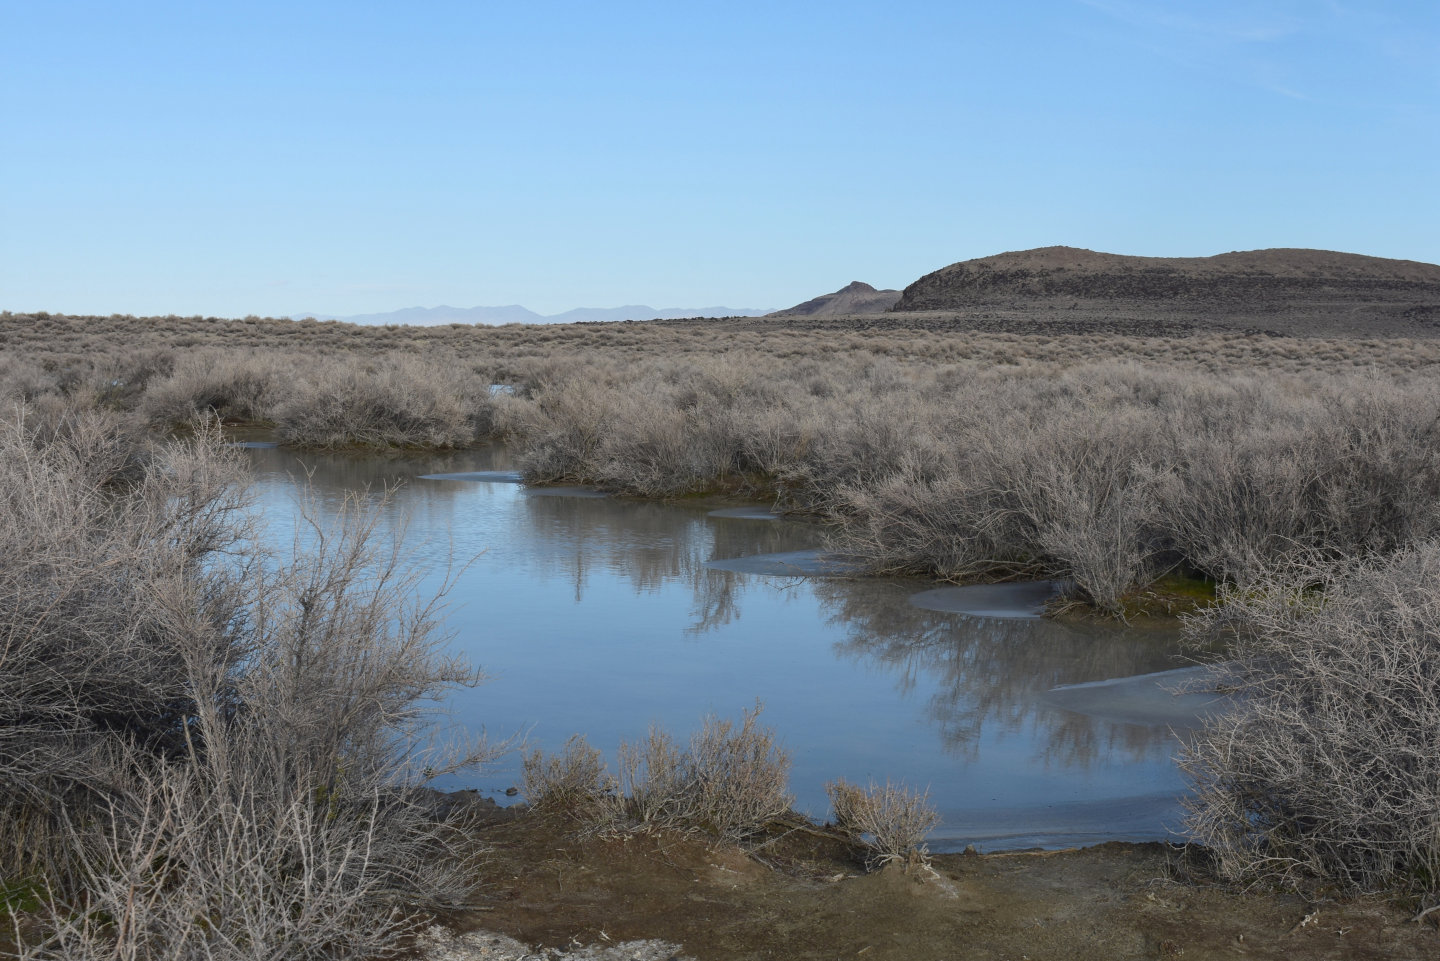
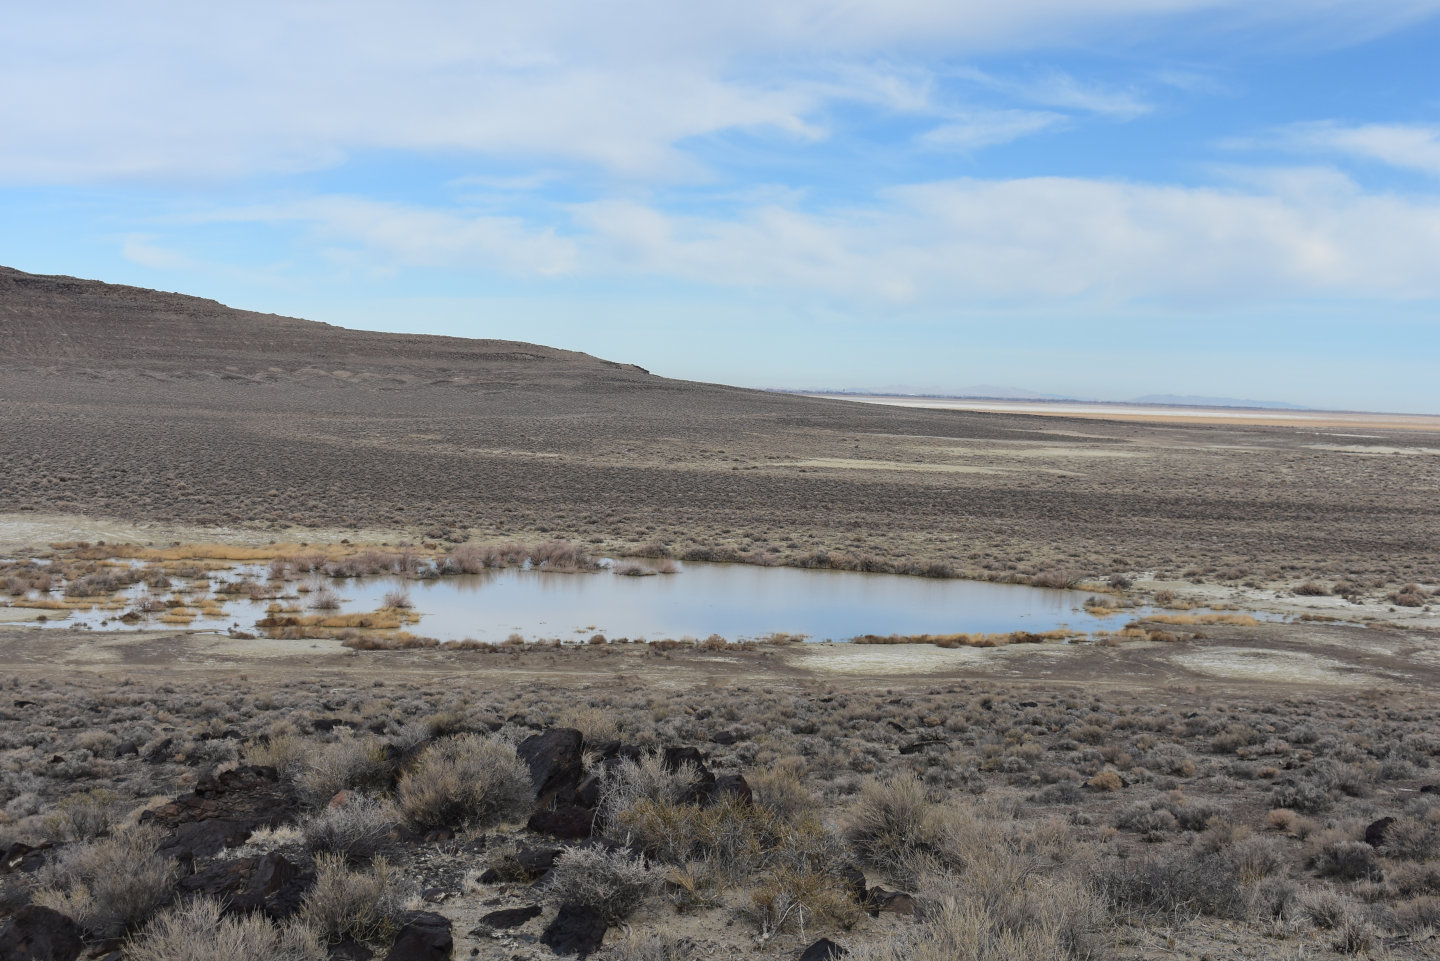
Grimes Point West Pond
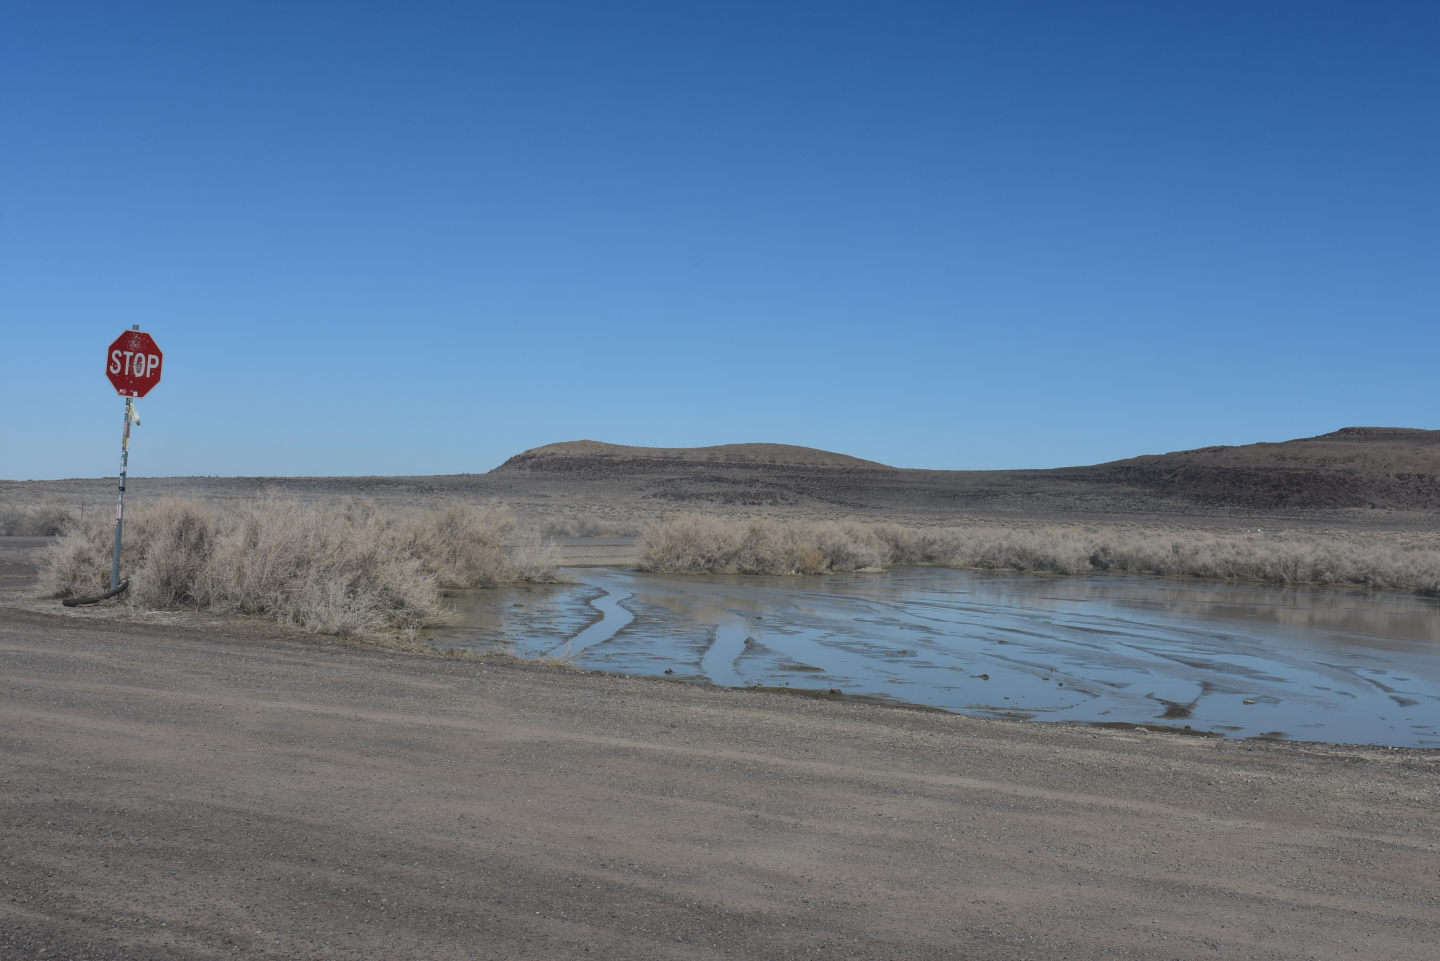
Macari East Stop Sign Pond
“Carson Lake” East Ridge Pond
Bass Flat Southwest Pond
Wildcat Freight Station Pond
Winter 2022 Fairy Shrimp Hatching History on “Carson Lake” Playa and Rawhide Flats
What Can We Learn from the Ponds on “Carson Lake” Playa?
“Carson Lake” Playa lies at the southwest end of the 40 km (25 miles) by 100 km (62 miles) basin that also contains the Carson Sink and Fallon and Stillwater National Wildlife Refuges (NWR) (see the figure below for the Environs of “Carson Lake” Playa). The basin is commonly referred to as the Carson Desert. The term Lahontan Valley seems to be used for the roaded and inhabited part of the basin. For practical purposes, “Carson Lake” Playa can be considered the federal and state land between the Naval Fallon Range Training Complex’s B-16 Range on the west and the Bunejug Mountains on the east and between Fallon Naval Air Station and the private land surrounding Fallon on the north and the White Throne Mountains on the south but including Bass Flat. This is an area about 18 km (11 miles) west-east and 10 km (6 miles) north-south. It covers and is larger than NDOW’s “Carson Lake” Wildlife Management Area (WMA, formerly “Carson Lake and Pasture”), which was transferred to the state from the Bureau of Reclamation in 2021. The greasewood desert north of Fallon may have ephemeral ponds from time to time but that area is within the railroad checkerboard of alternating sections of public and private land. The checkerboard is best avoided.
___This map is a screenshot of The National Map (Go to The National Map). The U.S. Geological Survey generally does not copyright or charge for its data or reports (unless printed).
___Blue shading represents, approximately, National Wildlife Refuges as traced from the PAD-US 2.0 – Federal Fee Managers layer of The National Map. Internal private lands are not shown.
___Pink shading represents, approximately, land controlled by the Department of Defense, updated with the expansion of the Navy’s Fallon Range Training Complex approved in the 2023 National Defense Authorization Act.
___Brown shading represents, approximately, land owned by the State of Nevada and managed by Nevada Department of Wildlife as “Carson Lake WMA”. This area was commonly referred to as “Carson Lake and Pasture”.
The Carson Desert is extremely flat. Spot elevations around “Carson Lake” on the “Carson Lake” 7.5-minute topographic map are 1,190.8 m to 1,194.3 m (3,906.8′ to 3,918.3′). The water level in “Pintail Bay” and “North Nutgrass Lake”, which have been surrounded by dikes, at the northern end of Stillwater Marsh was 1,179.6 m (3,870′) when the Stillwater NE 7.5-minute quadrangle was field checked in 1969. This is about 48 km (29 miles) northeast of the middle of “Carson Lake” for a gradient of 31 cm/km or 1.7 feet/mile. The lowest spot in Carson Sink has not been surveyed but is at least several kilometers north of Pintail Bay and probably several meters lower (e.g., spot elevation of 3,865 feet, or 1,178 m, in section 14, Township 23 North, Range 30 East, north of Fallon NWR on the Carson Sink SE 7.5-minute quadrangle).
Vegetation on the natural playa part of “Carson Lake” Playa is sparse and dominated by greasewood. Parts of the playa that receive irrigation return flows have “emergent wetland” with “cattails, alkali, and hardstem bulrush”, or “wet meadow and pasture” with “saltgrass, spike rush, and small amounts of alkali bulrush”, or ponds with pondweed and widgeon grass (U.S. Bureau of Reclamation, 2009, p. 15-16).
The northern edge of “Carson Lake” Playa is 12 km (7.5 miles) south of the center of Fallon. US 95 crosses the western part of the playa and US 50 clips the northeastern corner.
NDOW’s “Discover Your Public Land” page (www.ndow.org/your-public-land/) has minimal information on the “Carson Lake” WMA. The page does not mention fees, cows, pit latrines, or any restrictions on hiking but does say “[t]ravel is not permitted around seasonally closed gates”. I had previously downloaded a map of the WMA which had 6 parking areas, 4 “restrooms”, 6 horse corrals, and roads but can’t find it on the NDOW web site now. There is a different version at media.fishreports.com/reports/img-20230926-9ed1f784.jpg that doesn’t show the observation decks. The entrance is off Pasture Road at the Greenhead Hunting Club on the northwestern boundary of the property but I have never been there. Pasture Road goes due west from the entrance to US 95 and due north along the western boundary of the Naval Air Station.
Water boatmen (sub-order Heteroptera, family Corixidae), backswimmers (sub-order Heteroptera, family Notonectidae), and chironomids (Order Diptera) were found during surveys of “Sprig Pond” at “Carson Lake” (Tuttle and others, 2000, p. 41-42). Cladocerans of the genus Daphnia, which are also branchiopods like fairy shrimp, may have been present too but Tuttle and others (2000, p. 40) did not specifically state that they occur in “Carson Lake” as well as in the surveyed lakes of Stillwater NWR. Fairy shrimp may occur in habitats with these animals but “Carson Lake” ponds also have, or had, carp, mosquito fish (U.S. Bureau of Reclamation, 2009, p. 17), and Sacramento perch (Ekechukwu (1991, p. 6). Consequently, fairy shrimp are unlikely to live in semi-permanent ponds or connecting water bodies at “Carson Lake”. “The Water Cycle” section of the brochure for the Stillwater NWR (U.S. Fish and Wildlife Service, 2008) mentions that fairy shrimp eggs “can lie dormant for years” but says nothing about when they hatch (or have hatched), how common they are, where they can be found, or what habitat(s) they occupy. Undisturbed playa west, east, and south of “Carson Lake” may have depressions where ephemeral ponds could form from direct precipitation or snowmelt. Such ephemeral ponds offer the best opportunities for fairy shrimp at “Carson Lake” Playa.
Expansion of bombing ranges of the Navy’s Fallon Range Training Complex in 2023 further encroached on “Carson Lake” Playa (see Environs of “Carson Lake” Playa above). Essentially all of Carson Sink now lies within the B-20 bombing range. B-20 is used for advanced training for air to ground weapons such as HELLFIRE, Joint Direct Attack Munitions, and laser-guided weapons and for large force exercises (U.S. Department of Navy, 2020). The eastern boundary of the southern part of Range B-16 has moved to only 3.3 km (2 miles) west of US 95 across from “Carson Lake”. B-16 is used for ground maneuvers and live-fire exercises for SEALs (U.S. Department of Navy, 2020). For more on the Navy’s negligence and willful ignorance in preparation of the environmental impact statement (EIS) see “2023 Fallon Range Training Complex Expansion” on the Gabbs Valley page.
Congress didn’t care about the egregiously inadequate EIS. It perverted the National Defense Authorization Act for Fiscal Year 2023 (www.congress.gov/117/plaws/publ263/PLAW-117publ263.pdf) to give the Navy everything it wanted and to throw money and land at the Fallon Paiute Shoshone Tribe, the Walker River Paiute Tribe, and Churchill County. It gave a little land to Lander County and created a few small wilderness areas to placate environmentalists while eliminating the remaining wilderness study areas in Churchill and Lander counties. The Act also authorized land exchanges in the part of the railroad checkerboard that will not be bought for B-20. Fallon gets land for a new fire station, more gravel pits, a bigger landfill, more land for the water treatment plant, and maybe some recreational facilities.
The giveaway adds up to something like 102 square kilometers (39.5 square miles), not including land exchanges. $20 million each for Churchill County, the Walker River Paiute Tribe, and the Fallon Paiute Shoshone Tribe. None of this was mentioned in the EIS. The Navy also didn’t mention costs of about $18 million to build 30 miles of 8-inch diameter natural gas pipeline and about $26 million to build 13 miles of state highway to relocate them outside the new range boundaries. The federal government will spend something like $2 million to buy 264 square kilometers (102 square miles) of private land within the new range boundaries. This area is larger than both the water-righted area and the irrigated area of the Newlands Project (see below) and is more than twice as large as “Carson Lake” WMA.
On the other hand, geothermal development and mining of gold and possibly other elements on the bombing ranges would likely have generated sales of gold and electricity of around $1.8 billion over 20 years if the ranges had been moved elsewhere. Exploration and construction expenditures would have been more than $300 million. There are other areas in Nevada that could provide larger ranges with less impacts on private lands, mining, and geothermal development. Examples include the Owyhee Desert in western Elko and eastern Humboldt counties, between Smoke Creek Desert and Duck Flat and between Duck Flat and Boulder Flat in Washoe County, and Kumiva Valley and the Sahwave Range in western Pershing County.
Recent History of “Carson Lake” Playa
The current “Carson Lake” Playa is much different than “Carson Lake” Playa before 1850 due to settlement and agricultural development. The potential for fairy shrimp populations has changed accordingly.
If fairy shrimp were present before 1850, nobody noticed them. Paiutes who were born in the late 1800s and lived mostly at Stillwater Marsh had no knowledge of fairy shrimp. They did know of eating “brine fly” larvae collected at “Soda Lake” west of Fallon (Fowler, 2002, p. 41). Fowler (2002) compiled lists of local Paiute terms for various birds and other items used for food (p. 51) and of taxonomic categories of a broad range of flora and fauna (p. 183) but there are no names for fairy shrimp. Paiutes at “Mono Lake” ate both “brine fly” larvae and fairy shrimp. Unlike the prolific population of fairy shrimp in “Mono Lake”, short-lived populations of fairy shrimp in small ephemeral ponds may have been overlooked given the abundance of birds and other foods in Stillwater Marsh and “Carson Lake”.
There are some accounts of what “Carson Lake” was like before settlement. J.C. Fremont visited and named the water body for Kit Carson in 1845 on one of his explorations of the American West. In 1859, J.H. Simpson camped by the lake (Simpson, 1876, p. 85) while exploring for a wagon route. He found it full of fish and consequently not habitat for fairy shrimp. Simpson noted “some two dozen” Paiutes living by the lake in cattail houses. Dan DeQuille’s “Washoe Rambles” travelogue of an excursion through the Carson River watershed in 1861 also noted “a few scattering” cattail houses and larger “villages” on the south and east shores of “Carson Lake” (DeQuille, 1963, p. 30-32). The presence of Paiute dwellings suggests the lake, at the time, was a reliable source of foods, such as fish, birds, and bird eggs and, hence, was permanent for at least a few years at a time. For these years, the south branch of the Carson River must have been the primary channel. Although Paiutes moved back and forth between food sources during the year and from year to year, bands inhabiting the Carson Desert spent most of their time at Stillwater Marsh or “Carson Lake” (Fowler, 2002, p. 43). Paiutes referred to “Carson Lake” as Kussipa, meaning alkali water (Fowler, 2002, p. 25). Kussipa has also been translated as muddy water (Inter-Tribal Council of Nevada, 1976, p. 83). The implication of poor water quality suggests “Carson Lake” did not have large inflows every year like Pyramid Lake and Walker Lake.
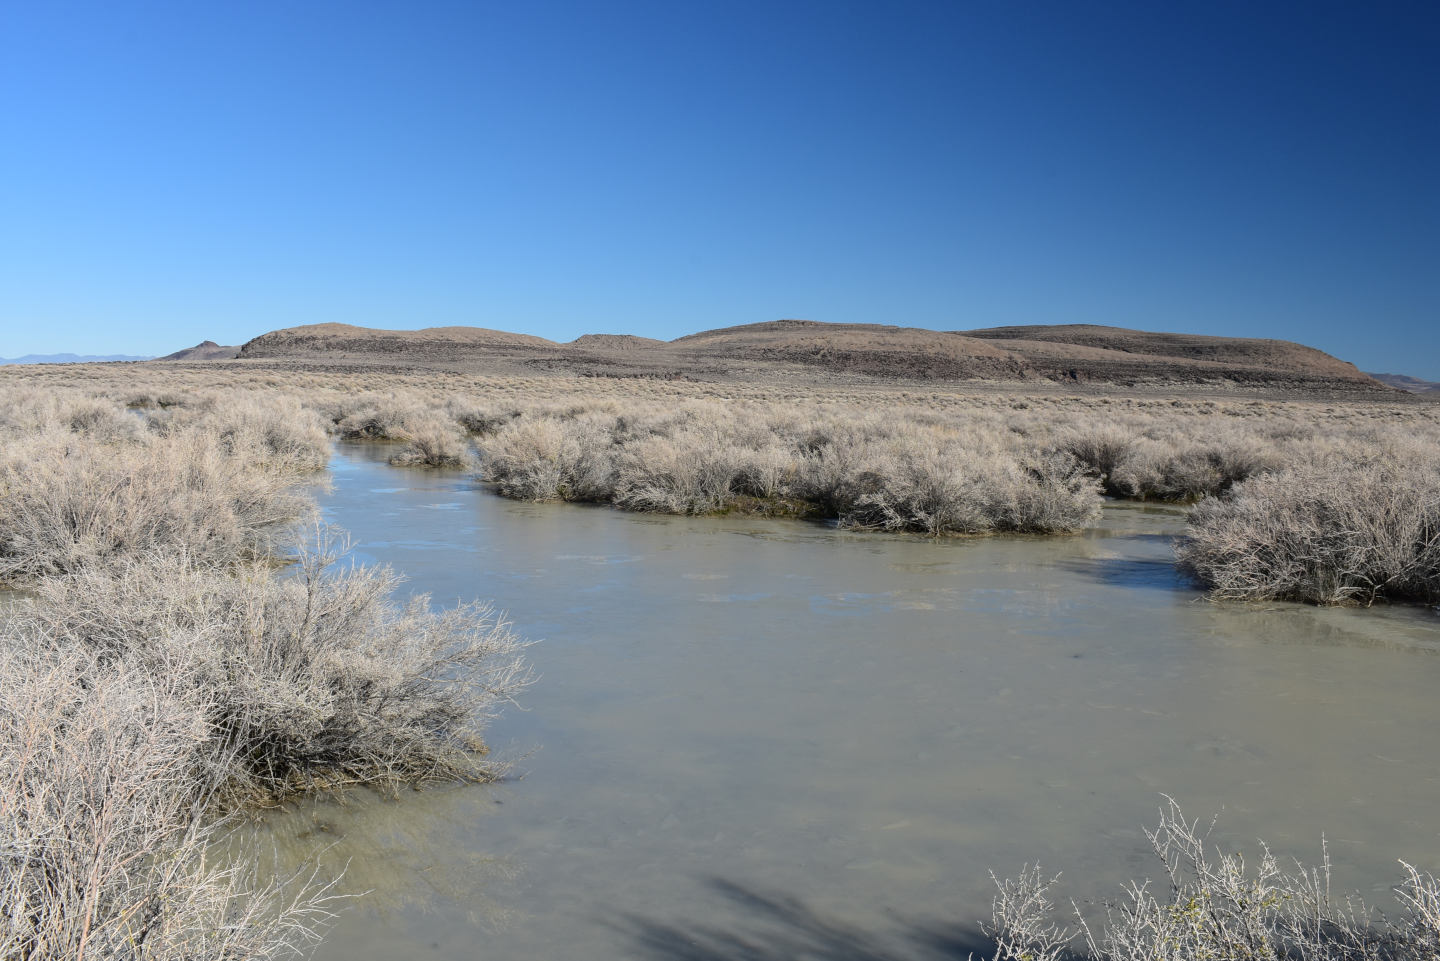
Stillwater Marsh, northeast of “Carson Lake”, has more abundant open water and wetlands than “Carson Lake”. “Carson Lake” is not necessarily the end of Carson River flows. If “Carson Lake” fills to a level of about 1,194 m (3,917′) (Grimes Point 7.5-minute quadrangle), which is only 3 m (10′) above the 1981 water surface elevation of 1,190.9 m (3,907′, “Carson Lake” 7.5-minute quadrangle, “Field Checked 1981”), it can spill to the northeast between Grimes Point and the southeast end of the runway at Fallon Naval Air Station near the current Grimes Point Slough (Grimes Point 7.5-minute quadrangle). Kerley and others (1993) identified the spill elevation as 3,919′ (1,194.5 m) and the lake bottom as 3,909′ (1,191.5). Stillwater Marsh also received minor inflows of ground water since the Paiutes knew of springs there (Fowler, 2002, p. 27, 36).
DeQuille (1963, p. 147) described the “two Sinks of the Carson” as “upper and lower sinks or lakes, joined together like the glasses of a pair of spectacles by the stream called the Slough” with the “Carson River coming down from the west through a belt of the same level desert country . . . emptying into the west side of the upper or south lake”, which is “Carson Lake”. The lower sink was north of Stillwater Marsh, where the last trickles of water finally evaporate. The 1869 General Land Office survey plat shows a “Stillwater Slough” emerging from “Carson Lake” in section 25, Township 18 North, Range 29 East (for the historical surveys go to www.nv.blm.gov/LandRecords/, choose “Rectangular Survey Plat” for “Land Record Type”, enter numbers for township and range, and click on the “Find” button). The slough winds its way to the northeast and is eventually lost among the lakes of Stillwater Marsh. It was flowing when Simpson camped at “Carson Lake” in 1859 (Simpson, 1876, p. 85). DeQuille (1963, p. 36) reported that the slough was a stream more than 18 m (“60 feet”) wide and had vertical banks 2.4-3.0 m (“8-10 feet”) high in June 1861. However, DeQuille tended to exaggerate as he described most mountains he visited as “perpendicular”. The toll bridge that DeQuille noted is testament to a significant stream nonetheless. The slough is likely one of the reasons the Pony Express and Overland Stage followed Simpson’s route along the south shore of “Carson Lake” (Fowler, 2002, p. 18). The Carson River thus supplied ample flows to “Carson Lake” and to Stillwater Marsh in some years of the middle 1800s.
Stillwater Slough didn’t always flow. The June 25, 1865 Virginia Daily Union reported:
- “A singular sight is presented just now in the immense amount of fish passing from the Lower to the Upper Sink of the Carson. This last spring the two sinks became so low by evaporation that the slough between them dried up entirely . . . Within a short time past, the river having raised, the Upper Sink is now flowing through the slough into the lower one. The poor alkalied fish, as soon as they got a scent of the fresh water, started after it . . . An eye witness informs us that in the slough there is a solid streak of fish constantly passing up it two feet thick and four or five feet wide” (McQuivey, 2005, p. 7).
The above quote implies that there was not an alternate route to Stillwater Marsh for Carson River water at the time.
Under natural conditions, there was always water in the Carson River but it did not always end up in the same place. Because the Carson Desert is so flat and the volume of spring run-off exceeds the capacity of the river channel in some years, it is easy for the Carson River to change course. During a major flood in 1862, the river re-occupied a previous channel (Fowler, 2002, p.11, Fig. 12 on p. 22; Hoffman, 1994, Fig. 5, p. 8) that forks to the north 7 km (4 miles) west of the intersection of US 50 and US 95 in Fallon and then turns almost due north north of Rattlesnake Hill to finally vanish near the sand dunes of Pelican Island and Battleground Point in the southern part of the Fallon NWR (Battleground Point, 7.5-minute topographic quadrangle). The settlers came to refer to this channel as Old River. That the Paiute name for this channel includes the word for trout (Fowler, 2002, p. 41) suggests that the Carson River may have more commonly taken the northern route to the Carson Sink than the southern branch to “Carson Lake”.
During another major flood in 1867, the Carson River opened an apparently new channel directly to the east through current Fallon about 1 km (0.6 miles) south of US 50 and became known as New River to the settlers (Fowler, 2002, p. 11 and see Fig. 12 on p. 22). 1869 and 1868 General Land Office survey plats show a “New Slough” cutting southeast across the northeastern corner of Township 18 North, Range 29 East, east of Fallon and joining a northeastward directed “Stillwater Slough” in section 18, of Township 18 North, Range 30 East. The geologic map of Morrison (1964, plate 11) shows about 2 dozen former river channels, as identified by fluvially deposited sand and gravel, twisting across the Carson Desert to “Carson Lake”, Stillwater Marsh, and Pelican Island. It is possible, then, that “Carson Lake” was dry for periods of years or decades in the past few centuries when the Carson River spilled to the north along Old River (labeled “Carson River” on The Battleground Point and “Indian Lakes” 7.5-minute quadrangles) or along other channels.
Comparisons of recent U.S. Geological Survey 7.5-minute (1:24,000 scale) and 30 minute x 60 minute (1:100,000) topographic quadrangles with General Land Office surveys beginning in 1869 illustrate major changes. Surveys for Township 18 North, Ranges 28 and 29 East in 1869; Township 18 North, Range 28 East, in 1875; and Townships 16 and 17 North, Range 29 East, in 1881 show the edge of “Carson Lake” 1-3 km (0.6-1.8 miles) north, west, and south of the area shown with a marsh symbol on the 1996 1:100,000-scale BLM map. In addition, the survey plats show extensive “Tule Swamps” or “Tule” north of “Carson Lake”. An 1869 survey plat shows the “Carson River” channel terminating in a “Tule Swamp” in section 23, Township 18 North, Range 28 East. This is about 2.5 km (1.5 miles) west of current US 95, 7.5 km (4.5 miles) south of current US 50, and 10 km (6 miles) northwest of the nearest marsh symbol on the current map of “Carson Lake”. This channel is now labeled as “South Branch” on the BLM map. The greasewood desert between the Navy’s B-16 range and US 95 west of “Carson Lake” was all “Grass and Tule” in 1875. The surveyors were not tasked with mapping lakes or swamps. Their purpose was to provide the means for settlers to accurately delineate their lands for deeds. However, they sketched in lakes and marshes because they didn’t need to set section corners where settlers could not farm or build houses.
Over the past 160 years or so, agricultural developments have gradually diverted more and more water from the Carson River. Flows to Stillwater Marsh and “Carson Lake” have decreased accordingly. The point of no return came in 1903 when the federal government broke ground for a project to divert the Carson and Truckee rivers to the flat lands around Fallon for irrigation. The project was named the Newlands Project when Senator Newlands died in 1919 (Simonds, 1996). The vision of irrigating 1,619 square kilometers (400,000 acres) never materialized because the desert soils were not as suitable for irrigated agriculture as the boosters had assumed. Irrigated areas were 174 square kilometers (43,000 acres) in 1913, 192 square kilometers (47,363 acres) in 1940, 234 square kilometers (57,817 acres) in 1960, about 271 square kilometers (67,000 acres) in 1980 (Simonds, 1996), and 237.5 square kilometers (58,669 acres) in 2009 (Truckee-Carson Irrigation District, 2010, p. 1-11). Evapotranspiration from flood-irrigated fields and canal seepage have greatly reduced flows to “Carson Lake”, to Stillwater Marsh, and to Carson Sink at Pelican Island. On the other hand, irrigation water has to be drained off the fields to prevent water-logged soils and salinization. Most of the drain water is dumped into the “Carson Lake” “Sump” to evaporate there. Most of the rest goes to Stillwater NWR. A little goes to Pelican Island. Estimates of the shrinkage of the wetlands of “Carson Lake” and of Stillwater Marsh even with the drain flows are as follows.
“Carson Lake”:
- Hoffman and others (1990, p. 5) – from 109 square km (27,000 acres) before 1905 to 23 square km (5,600 acres) in 1987 for a reduction to 21%, and
- Kerley and others (1993, p. 10-11, p. 19) – from an average annual area of 109 square km (27,000 acres) before 1845 to an average annual area of 40 square km (10,000 acres) for the 1967-1986 period and to a “projected” 20 square km (5,000 acres) (without purchased water?) for a reduction to 37% and then to 19%.
- Stillwater Marsh:
- Hoffman and others (1990, p. 5) – from 134 square km (33,000 acres) before 1905 to 39 square km (9,600 acres) in 1987 for a reduction to 29%,
- Kerley and others (1993, p. 12, p. 19) – from a maximum area of 223 square km (55,000 acres) before 1845 to an average annual area of 57 square km (14,000 acres) for the 1967-1986 period and to a “projected” 44.5 square km (11,000 acres) (without purchased water?) for a reduction to 25% and then to 20%, and
- Fowler (2002, p. 44) – from 134 square km (33,000 acres) in about 1900 to 12 square km (3,000 acres) in 1988 for a reduction to 10%.
These estimates indicate the recent sizes of “Carson Lake” and Stillwater Marsh have been reduced to about a third or a quarter since 1900.
Although the wetlands of “Carson Lake” and Stillwater Marsh have generally been shrinking for the past century as a result of agricultural practices, year to year variations due to weather have been extreme.
- Stillwater Marsh went dry in 1976-1977 (Kerley and others, 1993, p. 12).
- In 1983, the Refuge received “about eight times more” water than the amount it receives in a “normal year” and the most since 1945 (Rowe and Hoffman, 1990, p. 37). By February 1985, 858 square km (212,000 acres) of the normally dry Carson Sink playa was submerged to a maximum depth of about 3.6 m (“nearly 12 feet”). If the Sink has playa lakes with fairy shrimp, this would have been an extraordinary opportunity to spread fairy shrimp eggs over a huge region. However, it would not have been a good few years for fairy shrimp to hatch. The floods carried tui chub and carp into the Sink lake. There were an estimated 7 million fish on the Sink in January-February 1987 (Rowe and Hoffman, 1990). Their stinky deaths followed.
- In March 1995, Stillwater NWR had 6.5 square km (1,600 acres) of wetlands.
- In December 1995, Stillwater NWR had 43.7 square km (10,800 acres) of wetlands (Higgins and Miesner, 2002, p. 3).
In addition to water diversions for agriculture, human activities have changed the character of “Carson Lake” Playa in other ways.
1. “Carson Lake” Playa became part of the Carson River Mercury Superfund Site soon after Nevada became a state. The Site includes areas around the gold mines and mills between Dayton and Virginia City, which operated from 1860 to about 1880 (https://www.nps.gov/places/virginia-city-historic-district.htm). Mercury from there washed into the Carson River. As a result, the Site includes the Carson River and all its connected waterways below Dayton, including those in Lahontan State Park, all the canals and drains of the Newlands project, and the wetlands in “Carson Lake” WMA and Stillwater NWR (Hogan and Smucker, 1994; Nevada Division of Environmental Protection, 2018; U.S. Environmental Protection Agency, 2020, Figure 2). The Site wasn’t identified until 1990. Irrigated lands of the Newlands Project and yards in Fallon are not included in the Site. The mercury in the water is dissolved from mercury particles in stream, lake, and canal sediments (Hoffman and Thomas, 2000, p. 5), which are episodically redistributed by floods, such as those in 2017, 2019, and 2023.
2. Abnormally high mercury concentrations are widely distributed in animals frequenting the Carson River Mercury Superfund Site. What harm that has done to fish has not been a concern but it definitely poses a threat to humans who eat them. Means of total mercury concentrations in flesh of fish from “Lahontan Reservoir”, separated by species and by year, are all greater than 0.86 ppm, wet weight (3.0 ppm dry) (Ekechukwu 1991; Hogan and Smucker, 1994; U.S. Environmental Protection Agency, 2020, Table 4). The European Union set a maximum allowable total mercury concentration in aquatic animals eaten by people of 0.5 ppm or 1.0 ppm wet weight, depending on species, while recognizing that up to 90% of such mercury is in the form of methylmercury. The World Health Organization’s provisional tolerable weekly intake for dietary methylmercury is 0.51 ppm for a fetus (based on 1 meal of 227 g by a pregnant person weighing 72.5 kg, 160 pounds). The California Environmental Protection Agency (2023, p. 40) set a threat threshold of 0.44 ppm in fish for fetal risk and a threshold of 1.31 ppm for women 50 or older and men over 18 (1 meal of 227 g by a person weighing 72.5 kg). The 2022 Nevada Fishing Regulations recommended no consumption of fish from the Carson River below Dayton, “Lahontan Reservoir”, and “all waters in Lahontan Valley”. NDOW continues to stock “Lahontan Reservoir” with fish for those who dare.
3. Ducks in the Carson River Mercury Superfund Site are also contaminated with mercury but not as uniformly as fish. In some years, some duck species have muscle mercury concentrations higher than those in fish. In 1989, the Nevada Division of Health issued a warning for consumption of northern shoveler ducks (Hoffman and others, 1990) based on 10 samples collected from “Carson Lake” in October 1987 (Rowe and others, 1991) that had total mercury concentrations ranging from 0.58 ppm to 15.5 ppm, wet weight, and averaging 5.9 ppm. Other “Carson Lake” duck samples with means exceeding 0.50 ppm, wet weight, include 10 shovelers in summer 1989, 6 mallards in summer 1987, 6 mallards in fall 1987, 3 mallards in summer 1990, 10 green-winged teal in fall 1989, and 3 coots in summer 1990 (1990-1992 data from CB & I Federal Services, LLC, 2017). Redheads in summer 1987, fall 1987, and summer 1990 and shovelers in summer 1990 had lower mercury concentrations. Ducks shot in the Stillwater Wildlife Management Area (Stillwater NWR and areas to the west before the current boundaries were set) generally had lower mercury concentrations. Means for shovelers collected in fall 1987, summer 1990, fall 1990, and fall 1991 exceeded 0.50 ppm but those collected in summer 1987 did not. Means for mallards shot in summer 1987, fall 1987, and summer 1990 were all less than 0.50 ppm mercury. Redhead means in summer 1987 and fall 1987 were less but a single bird shot in summer 1990 had 0.53 ppm mercury. 6 canvsabacks shot in fall 1987 had very low total mercury concentrations. 8 coots collected in summer 1990 had concentrations averaging 1.33 ppm. The mean for fall 1991 teals was barely greater than 0.50 ppm while those for fall 1990 and fall 1992 were less.
To a first approximation, the same risk thresholds for total mercury in fish can be used for ducks because most mercury in birds is methylmercury. Vermeer and others (1973) found that methylmercury in the muscle of 5 ducks sampled at “Clay Lake” in western Ontario “ranged from 69 to 99 percent of total mercury”. Methylmercury was 61% of total mercury in northern shoveler livers, on average, and 78% of total mercury in cinnamon teal livers from the “Great Salt Lake” area (Cline and others, 2011, p. 146). The Utah Department of Health stated that “In duck tissue, the majority of mercury is methylmercury” in a report supporting a health advisory for ducks shot near “Great Salt Lake” (Scholl and Ball, 2006, p. 5). Figure 86 in Ackerman and others (2014, p. 159) shows that methylmercury concentrations in livers of avocets, black-necked stilts, Caspian terns, and Forster’s terns at San Francisco Bay scatter symmetrically around the line for 90% of total mercury up to about 8 ppm total mercury but then decrease to about 60% of total mercury at 60 ppm due to a demethylation process in the liver. 8 ppm is already far above the threshold for harm in humans. And yet there are no health warnings for eating ducks from “Carson Lake” or Stillwater NWR and no mention of mercury in ducks in the 2022-2023 Nevada Small Game Hunting Regulations and Seasons.
Contracted by the U.S. Environmental Protection Agency, CB & I Federal Services, LLC (2017) made the risk of eating ducks from the Carson River Mercury Superfund Site disappear. CB & I Federal Services, LLC (2017) claimed, contrary to the previous work of Hogan and Smucker (1994) and the works cited above, that all the mercury in ducks is mercuric chloride. This is in spite of the finding in Appendix C of CB & I Federal Services, LLC (2017, pdf p. 1561) that “Methylmercury accounted for greater than 90 percent of total mercury in blood, liver, and feathers of the fledgling swallows” and a garbled statement on methylmercury in double-crested cormorants, snowy egrets, and black-crowned night herons on pdf page 1562. The reference dose for mercuric chloride is 3 times higher than the reference dose for methylmercury. That means the health risk is the same for eating food with a mercuric chloride concentration 3 times greater than the methylmercury concentration in the same amount of food. As of 2021, the U.S. Environmental Protection Agency continued to embrace the false assumption that ducks in the Superfund site have mercury only as mercuric chloride (U.S. Environmental Protection Agency, 2021, see RAO1).
CB & I Federal Services, LLC (2017) made other mistakes and false assumptions. It ignored the NDOW survey data used by Hogan and Smucker (1994) that showed how many ducks the average Nevada hunter bags. Instead of finding that Nevada hunters ate 4.20 kg (9.3 pounds) of duck over a year of 350 days (Hogan and Smucker, 1994, Table E.7), it found that hunters ate 0.69 kg (1.5 pounds) of duck over a year of only 10 days (CB & I Federal Services, LLC, 2017, Table 4.25, pdf p. 475).
For calculating an “average” duck concentration, CB & I Federal Services, LLC (2017) eliminated the highest mercury concentrations by claiming that pre-1990 data, i.e., 1987-1989, was too old. Of the 107 1990-1992 analyses, it omitted all 13 analyses from “Carson Lake” and all 4 from “canal/ditch” without explanation. The “Carson Lake” analyses had a mean of 2.11 ppm mercury and a geometric mean of 1.20 ppm, wet weights. The remaining 90 analyses had a mean of 0.88 ppm and a geometric mean of 0.42 ppm. The geometric mean was chosen for further calculations because the data are not normally distributed (CB & I Federal Services, LLC, 2017,Table B6-4, pdf p. 410). The teals (labeled “Eurasian teals” by CB & I Federal Services, LLC, 2017) had much lower mercury concentrations than the shovelers. 45 teals had a geometric mean mercury concentration of 0.165 ppm while 28 shovelers had a geometric mean of 3.961 ppm, wet weights (from CB & I Federal Services, LLC, 2017, Attachment B-13. BAF Backup Information – Waterfowl Tissue Data, pdf p. 1332-1337). It would be inconvenient for hunters to keep track of the species they shoot so CB & I Federal Services, LLC (2017) just averaged out the species differences. Nobody wants to survey ducks every year so CB & I Federal Services, LLC (2017) just assumed that 1990-1992 data are representative of all time. Utah agencies did not average out species or year differences in their health warnings for ducks at “Great Salt Lake” (Utah Division of Wildlife Resources, 2006; Scholl and Ball, 2006). No agency averages out fish species differences (e.g., California Environmental Protection Agency, 2023).
To ensure confusion, CB & I Federal Services, LLC (2017) chose a bizarre method to determine an average duck concentration for use in the health risk assessment. Instead of using mercury concentrations in ducks directly, it used mercury concentrations in water body sediments to calculate a different average mercury concentration for ducks. Its method is too ludicrous to describe here.
4. Flood irrigation and canal seepage of the Newlands Project has raised the water table over extensive areas of “Carson Lake” Playa (Maurer and others, 1993). The good news is water levels in shallow domestic wells are higher than they would be otherwise. The bad news is that this causes water-logging of the alfalfa fields and required the installation and maintenance of an extensive drainage system. It also increases the volume of ground water less than 3 m (10′) deep that is susceptible to evapotranspiration (Herrera and others, 2000, p. 28).
5. The need for drainage of the Newlands Project was not recognized until after the water began flowing. “By 1912, large areas on the project were saturated and unusable” (Simonds, 1996, p. 15). Fields became water-logged and soluble minerals in the desert soils poisoned crops and had to be flushed off. The subsequent ad-hoc drain construction directed irrigation returns either to Stillwater NWR for evaporation there or discharge onto the Carson Sink or to a “Sump” at “Carson Lake” to evaporate (U.S. Bureau of Reclamation, 2009; Truckee-Carson Irrigation District, 2010).
6. Evaporation of irrigation water from fields (99% flood-irrigated – Truckee-Carson Irrigation District, 2010, p. 1-2), canals, drains, and reservoirs and plant uptake (70% of crops are alfalfa – Truckee-Carson Irrigation District, 2010, p. 1-2) increases the concentrations of naturally occurring and potentially toxic elements in the remaining water. The wetlands of Stillwater NWR are no longer flushed by fresh waters of the Carson River, they are instead made more saline by irrigation run-off (Tuttle and others, 1996). “Carson Lake” is worse because it currently has no natural or artificial surface outlet.
Some waters collected from drains in “Carson Lake” WMA and Stillwater NWR are toxic to aquatic animals. That is not because of mercury. Mercury concentrations in water are uniformly low. Water prepared in the laboratory to mimic water from Pintail Bay killed 100% of the Daphnia magna (“cladocerans”, Crustacea: class Branchiopoda, order Anomopoda, family Daphniidae) test animals within 48 hours even if diluted to 34% and even without added trace elements like boron, copper, and lithium (Dwyer and others, 1992). “Pintail Bay” water also killed 100% of striped bass within 96 hours unless diluted to 70% or less (without trace elements) or to 49% or less (with trace elements) (Dwyer and others, 1992).
In 10-day tests with waters from drains or lakes renewed daily, Hunter Drain water was particularly deadly. It killed all Daphnia magna and bluegills within 3 days, all fathead minnow larvae within 5 days, and all mysid shrimp and sheephead minnow larvae within 6 days (Finger and others, 1993). While concentrations of solutes in Hunter Drain were consistently higher than those in D-Line Canal waters, which had 0 mortality, changes of concentrations of more than an order of magnitude over the test period may have contributed to the high mortality (e.g., chloride 84-13,000 mg/L, boron 810-49,000 mg/L, molybdenum 20-1,300 mg/L). The waters of “Stillwater Point Reservoir” had intermediate effects. After 9 days, 20% of the bluegills, 70% of the fathead minnow larvae, and 75% of the Daphnia magna were still alive (Finger and others, 1993). In most other waters, bluegills had higher survival rates than Daphnia magna.
Drain and lake water quality vary rapidly during the irrigation season and so does mortality. For March, May, and August test waters, death rates of Daphnia magna after 10 days changed from 10% to 90% at Upper West Side drain at Solias Road and from 20% to 100% at Stillwater Slough (Higgins and Miesner, 2002). Conversely, death rates changed only from 60% to 65% at Harmon Drain by Ditch House Road and from 40% to 45% at Sheckler Drain upstream of almost all the irrigation. No deaths occurred in March water from Paiute Diversion Drain or in May water from Stillwater Slough (Higgins and Miesner, 2002).
Specific causes of the toxicity have not been determined. It appears that various combinations of major elements and trace elements are deadly. Hallock and Hallock (1993a) attributed the toxicity to the combined presence of arsenic, boron, lithium, and molybdenum. Whatever the details, there is a positive correlation between total dissolved solids (TDS), or salinity, and mortality. Evaporation causes higher TDS concentrations.
Note added, summer 2024: The record snowpack in the Sierra Nevada in the 2022-2023 winter, above normal summer 2023 rains, and above normal snowpack in the 2023-2024 winter resulted in the flooding and major expansion of “Carson Lake” after March 2023 and persistence until late summer 2024. The extent of flooding was easily seen from US 95. This could have had good and bad effects.
On the good side, more “spills” from “Lahontan Reservoir” to keep the reservoir from overflowing would have flushed the Newlands canals and drains and the wetlands in Stillwater NWR with fresh water and reduced lake salinities. This didn’t help “Carson Lake”. The fact that the dikes in “Carson Lake” remained submerged from spring 2023 into spring 2024 indicate “Carson Lake” was not similarly flushed. Although the flood waters no doubt dissolved a lot of the minerals that had accumulated in “Carson Lake” over the years due to evaporation, the water didn’t go anywhere. The minerals would have precipitated again as evaporation ran its course. Any fish washed downstream by the floods would have benefited fish-eating birds at “Carson Lake” WMA and Stillwater NWR. On the bad side, the flooding would have mobilized and redistributed mercury. Unless the U.S. Fish and Wildlife Service took samples, no one will know whether birds or fish acquired abnormally high levels of mercury and whether chicks developed more deformities or not because of the flooding.
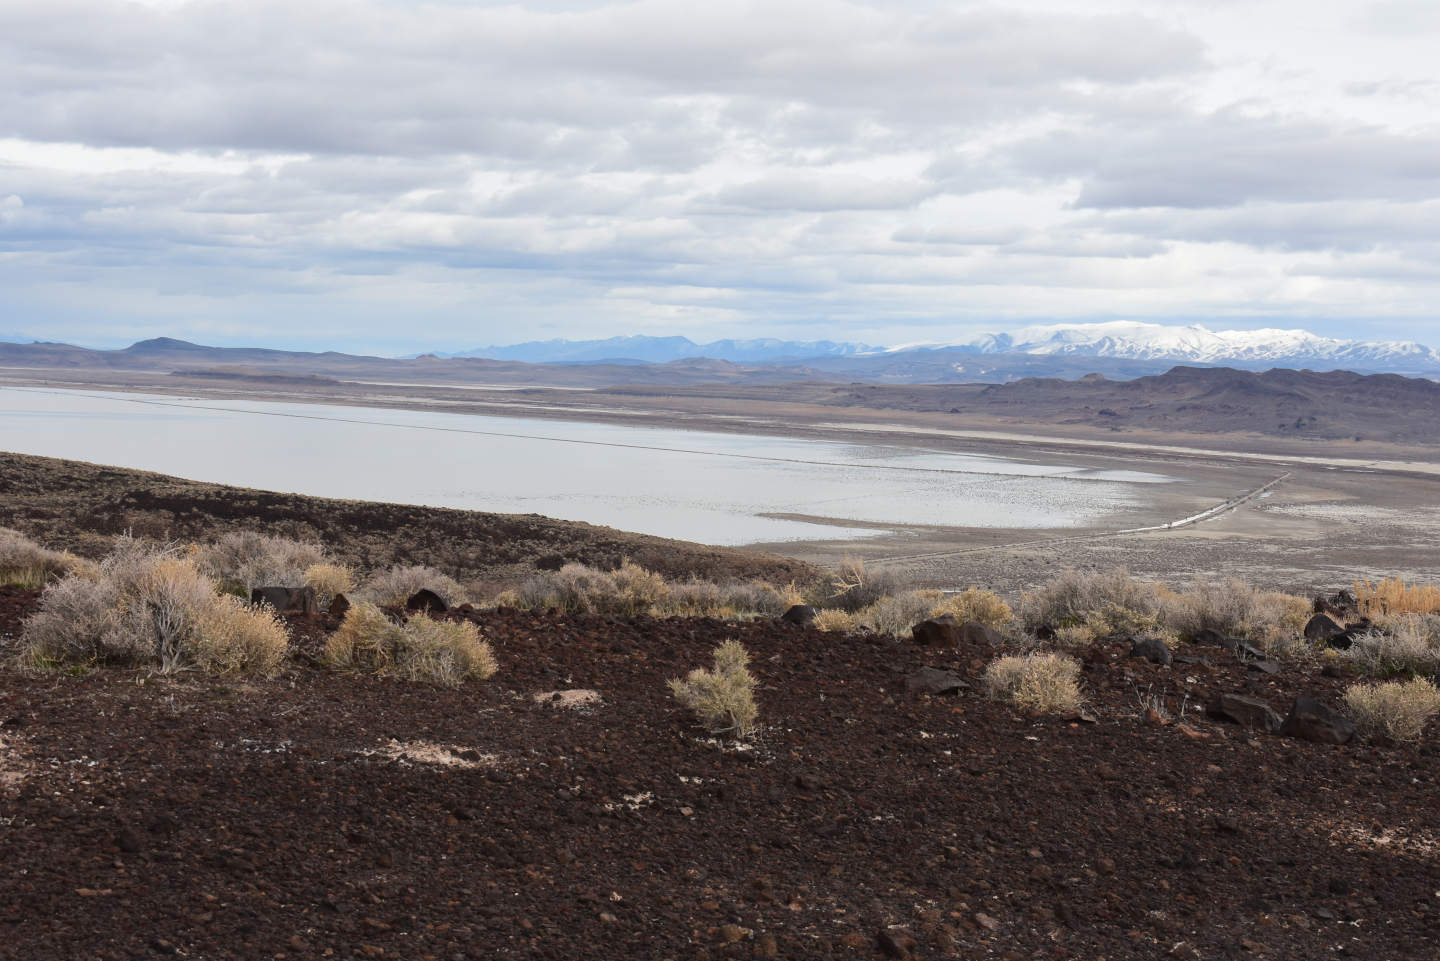
February 15, 2024: “Carson Lake” is still flooded. It never dried up after heavy run-off in spring 2023. This is clear evidence that any potentially harmful major solutes (e.g., sulfate) or trace elements (e.g., arsenic, boron, selenium, molybdenum) that are concentrated in the Sump by evaporation can be redissolved and redistributed throughout “Carson Lake” and adjacent wetlands.
7. Partially evaporated irrigation water that does not finally evaporate from Carson Sink or “Carson Lake” seeps into the ground and contaminates the shallow ground water. Concentrations of TDS and potentially harmful trace elements increase. Ground water contaminated by irrigation water seeps back into the drains when flows are low and contaminates water in the drains while being again subject to evaporation. It is a cycle of salinization.
The shallow ground water under the Newlands Project is derived from irrigation water. All 14 water samples from wells less than 15 m (49′) deep have tritium concentrations greater than 30 picoCuries/liter (Whitney, 1994; Welch and others, 1997). These waters must have entered the ground water system more recently than 1959 because rain could have had such high tritium concentrations only after nuclear weapons testing began. Recharge to shallow ground water near Fallon has been estimated to be 56% from canal seepage, 37% from “irrigation losses” (this may mean downward percolation from flooded fields), 5% from precipitation, and 8% from drains (U.S. Bureau of Reclamation, 2013, p. 3-60).
Shallow ground water samples have TDS concentrations up to 100,000 mg/L and chloride concentrations up to 30,000 mg/L. The ultimate source of the shallow ground water is outflow from “Lahontan Reservoir”, where Carson and Truckee river waters are combined. This outflow has TDS concentrations of 168-503 mg/L and chloride concentrations of 12-59 mg/L (n=7) (Hoffman and others, 1990; Rowe and others, 1991). Although irrigation water and the shallow ground water would have leached some solutes from previously unsaturated soils and sediments above the pre-Newlands water table, the amount of leaching has no doubt decreased since completion of Lahontan Dam in 1915. In describing the evolution of high-TDS waters at “Lead Lake” in Stillwater NWR, Lico (1992, p. 47) wrote that “evaporation appears to be the dominant process” for major elements and particularly for the trace elements boron and lithium. Dissolution of efflorescent salts of sodium and potassium chloride that were previously precipitated from water evaporating above the water table may have contributed to evolution of the highest TDS concentrations (Lico, 1992, p. 47).
The range of measured chemical concentrations in shallow ground waters overlaps with and extends to higher concentrations than the range of deadly drain waters. There has been 1 test of its toxicity. Water from a well west of the Stillwater NWR boundary near TJ Drain killed all bluegills, fathead minnow larvae, and Daphnia magna within 24 hours, even when diluted to 12.5% (Finger and others, 1993). The well water had a moderate TDS of 7,900 mg/L but high concentrations of some trace elements, such as arsenic at 0.56 mg/L, boron at 24.4 mg/L, lithium at 1.64 mg/L, and molybdenum at 1.15 mg/L. Mercury and selenium were below detection limits of 0.0003 mg/L (Finger and others, 1993, p. 29).
The U.S. Environmental Protection Agency’s freshwater aquatic life maximum concentration for arsenic is 0.34 mg/L and its primary drinking water standard is 0.01 mg/L. The aquatic life criteria for adverse effects in sensitive aquatic animals due to boron is 10 mg/L (Eisler, 1990, p. 27). The World Health Organization has established a “guideline value” of 2.4 mg/L for boron in drinking water. Harmful effects of lithium have not been demonstrated but were inferred by Hallock and Hallock (1993a). Concentrations this high are rare. Nevada has a 4-day aquatic life criterion for molybdenum of 1.65 mg/L (Nevada Administrative Code 445A.1236).
14 wells in 4 clusters were drilled to depths of 4.6-10.7 m (15-35′) at the northeastern corner of “Carson Lake” to test the shallow ground water there. Mean concentrations (mg/L) in the 10 wells 7.6 m (25′) or less deep are 15,890 chloride, 9,900 sulfate, 0.406 arsenic, 53.4 boron, 1.07 lithium, 1.65 molybdenum, 0.006 selenium, 0.50 uranium, and 0.16 zinc (Whitney, 1994). TDS was not measured but the sums of the major solutes averaged 40,130 mg/L. Mercury was below the detection limit of 0.0001 mg/L. The deeper wells had about the same concentrations but mean arsenic (0.24 mg/L) and uranium (0.36 mg/L) concentrations were lower and mean selenium (0.033 mg/L) concentration was higher (Whitney, 1994).
The U.S. Environmental Protection Agency’s secondary drinking water standards for sulfate and chloride are 500 mg/L and 250 mg/L, respectively, and its primary drinking water standard for uranium is 0.030 mg/L. Nevada has 4-day aquatic life criteria for selenium and zinc of 0.0019 mg/L and 0.12 mg/L, respectively (Nevada Administrative Code 445A.1236).
At the same time, there are many domestic wells that tap the shallow ground water. In 1993, there were 5,000 wells in the shallow groundwater aquifer (maximum depth 15 m, 50′, by convention) and in the intermediate aquifer below it (maximum depths to between 500′ and 1,000′) (Maurer and others, 1994). Many have good water although high arsenic concentrations are common. The wells with the best water are close to Newlands canals and benefit from the seepage.
In spite of all that has been done to “Carson Lake” Playa and Stillwater NWR, large numbers of water birds still show up every year, weather permitting. There have been no incidents of widespread deaths or deformities of birds or fish at “Carson Lake” WMA or Stillwater NWR like there were at Kesterson National Wildlife Refuge in 1983.
However . . .
- Sensitive plant species have decreased in abundance at Stillwater Marsh. Cattails “are now found only in scattered patches” (Kerley and others, 1993, 18). Coontail and horned pondweed have also declined. Species more tolerant of high TDS, such as widgeon grass and sago pondweed, have increased in abundance.
- “Aquatic-invertebrate communities in Lahontan Valley wetlands, particularly in Lead Lake [Stillwater NWR] and Sprig Pond [“Carson Lake” WMA], exhibited some characteristics consistent with impaired stream systems, including absence of sensitive taxa, dominance of tolerant taxa, and low taxa richness” (Tuttle and others, 2000, p. 55).
- Bioaccumulation of mercury and selenium are indicated by concentrations in water commonly below the analytical detection limits and high concentrations in organic-rich detritus (Hallock and others, 1993a, p. 45-46). Further biomagnification is indicated by very high concentrations of both in some water birds (Hallock and others, 1993b) and of mercury in fish.
- “Fish communities in these wetlands possess many of the characteristics of a degraded fishery, including limited species diversity, predominance of tolerant species, skewed trophic structure, and lack of piscivorous fishes” in addition to ages skewing young (Tuttle and others, 2000, p. 55). Introduced largemouth bass once thrived at “Carson Lake” but the population “virtually disappeared” in the 1970s (Kerley and others, 1993, p. 19). Even fathead minnow and tui chub may have disappeared from “Sprig Pond” (“Carson Lake” WMA). Only carp were captured in 1995-1996 (Tuttle and others, 2000, p. 47).
- “Concentrations of agricultural-drainage-related trace elements found in Lahontan Valley are within the range of concentrations associated with a variety of direct and indirect effects on fish and wildlife, including altered behavior; biochemical and histological effects, immunosuppression; decreased reproduction, malformation of embryos, and mortality” [internal citations omitted] (Tuttle and others, 2000, p. 40), particularly aluminum, boron, and mercury (Tuttle and others, 2000, p. 55). Methylmercury causes mostly neurological problems but no one has tested birds at Stillwater NWR for ataxia, memory loss, or reduced learning ability.
- “Lead Lake has a history of avian botulism and unexplained fish and migratory bird deaths, and most of the emergent vegetation has perished in the last 30 years” (Hallock and others, 1993a, p. 39). “Aquatic-bird occurrence, nesting, and reproduction have declined since the beginning of the Newlands Project”. That is primarily due to habitat loss (Tuttle and others, 2000, p. 55).
- Mink, river otters, frogs, and turtles were well known to the Paiutes at Stillwater Marsh in the late 1800s, but are now absent from wetlands in the Carson Desert (Kerley and others, 1993, p. 19). Muskrats and snails are no longer abundant. Remnant populations of clams have survived in waters with the lowest TDS concentrations (Kerley and others, 1993).
An attempt to help the water birds (my guess) by improving water quality at “Carson Lake” WMA and Stillwater NWR was made with the 1990 Truckee-Carson-Pyramid Water Rights Settlement Act. It authorized the U.S. Department of Interior to purchase water rights in order to maintain 101 square km (25,000 acres) of wetlands. There is no unused water available in either the Carson or Truckee rivers. Water rights would have to be bought from the Newlands Project. However, 101 square km is about 40% of the Newlands Project area irrigated in 2009 (238 square kilometers, 58,669 acres, Truckee-Carson Irrigation District, 2010, p.3). Would farmers of the Newlands Project sell out and idle almost half their collective acreage? It seems the U.S. Congress conjured up a fantasy.
U.S. Fish and Wildlife Service (1996, p. 1-5) determined that it would need 154.2 billion liters (125,000 acre-feet) per year to sustain those wetlands. Subtracting the expected deliveries of drain flows and spills from the Newlands Project, that leaves 118 billion liters (95,600 acre-feet, 31.2 billion gallons) per year to be purchased (U.S. Fish and Wildlife Service, 1996, p. 2-22, 2-28, 2-34 to 2-35). Due to different water duties for bottom lands and wetlands specified in the Alpine Decree (U.S. Fish and Wildlife Service, 1996, p. 2-21), the federal government would actually have to buy 138 billion liters (111,850 acre-feet) per year of bottom land water rights to get the water needed for the wetlands. Some progress has been made but the effort may be stalled. As of 2022, water rights for 60.5 billion liters (49,040 acre-feet) per year had been purchased (thenevadaindependent.com/article/wildlife-agencies-work-to-restore-wetlands-for-declining-great-basin-shorebird-populations).
Impacts on fairy shrimp have been few. Fish have excluded or will exclude them from past, current, and probably future wetlands. If fairy shrimp ever lived in the “Sump” and got killed off by poor water quality, that’s no worse than being excluded from a bigger “Carson Lake” before 1850 by fish. Eggs of populations west of US 95, if any, may have been flushed into “Carson Lake” by diversions from V Line Canal during the flood years. Although avocets, stilts, or other birds could eventually carry eggs back to such ponds, they would just get flushed out again in future floods. Such flushing could have been equally or more extensive before 1850. The most likely habitat for fairy shrimp on “Carson Lake” Playa is small, ephemeral ponds among the greasewood away from any agricultural development or wetland.
Grimes Point West Pond (Stillwater BLM Office)
___This map is a screenshot of The National Map (Go to The National Map). The U.S. Geological Survey generally does not copyright or charge for its data or reports (unless printed). A pond location is indicated by an “X”, which corresponds to the coordinates given in the data spreadsheet. Labels in quotations are from 7.5-minute topographic quadrangles.
___Red lines are the U. S. National Grid with a spacing of 1,000 m and intersection labels consisting of the UTM zone (e.g., 11S, 12T), a 2-letter 100-km square designation (e.g., LC, XN), and a 4-digit number. The first 2 digits of the number represent the 1,000-meter Easting and the second 2 digits the 1,000-meter Northing, as seen in the example Easting and Northing. Unlike latitude and longitude, the National Grid is rectilinear on a flat map, the units of abscissa and ordinate have equal lengths, and the units (meters) are measurable on the ground with a tape or by pacing.
___Gray shading represents private land as traced from the PAD-US 2.0 – Federal Fee Managers layer of The National Map.
___Pink shading represents land controlled by the Department of Defense.
___State land of Carson Lake and Pasture is not delineated but covers the area west of about Easting 358,500 and south of the private land, or about 4,359,500 North. Lands to the east of 358,500 East and those to the north of 4,359,500 North and east of Fallon Naval Air Station are public.
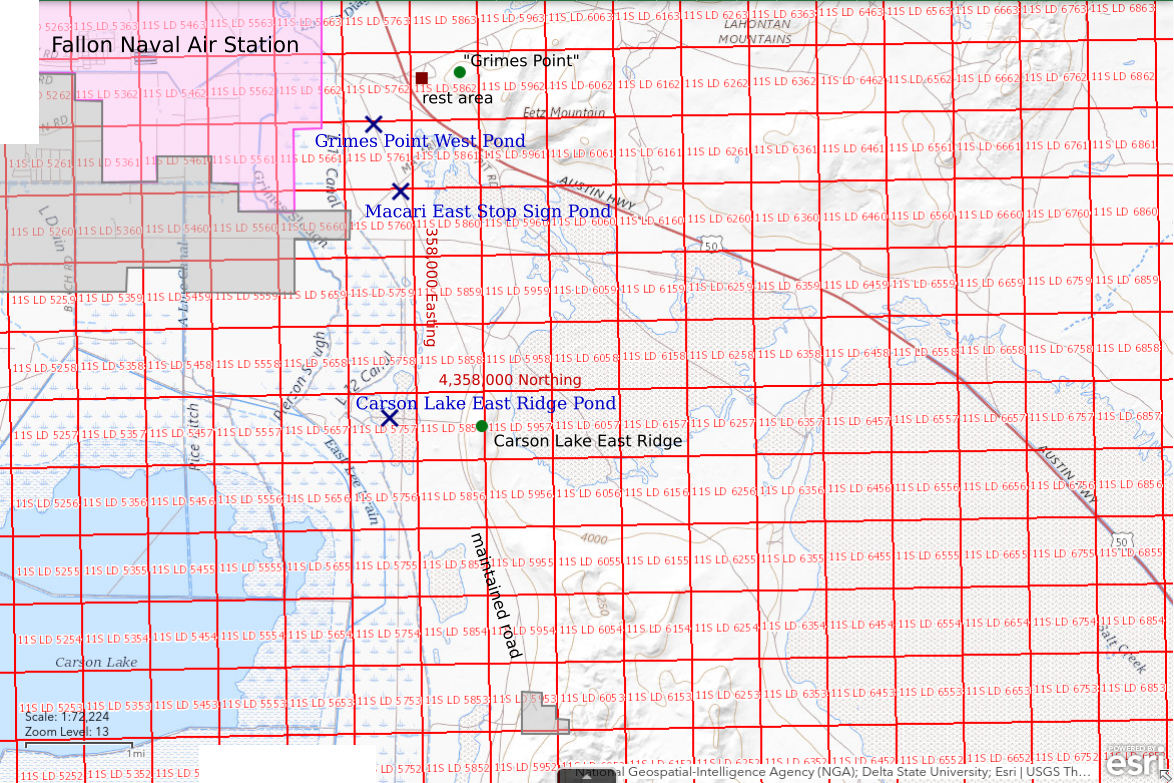
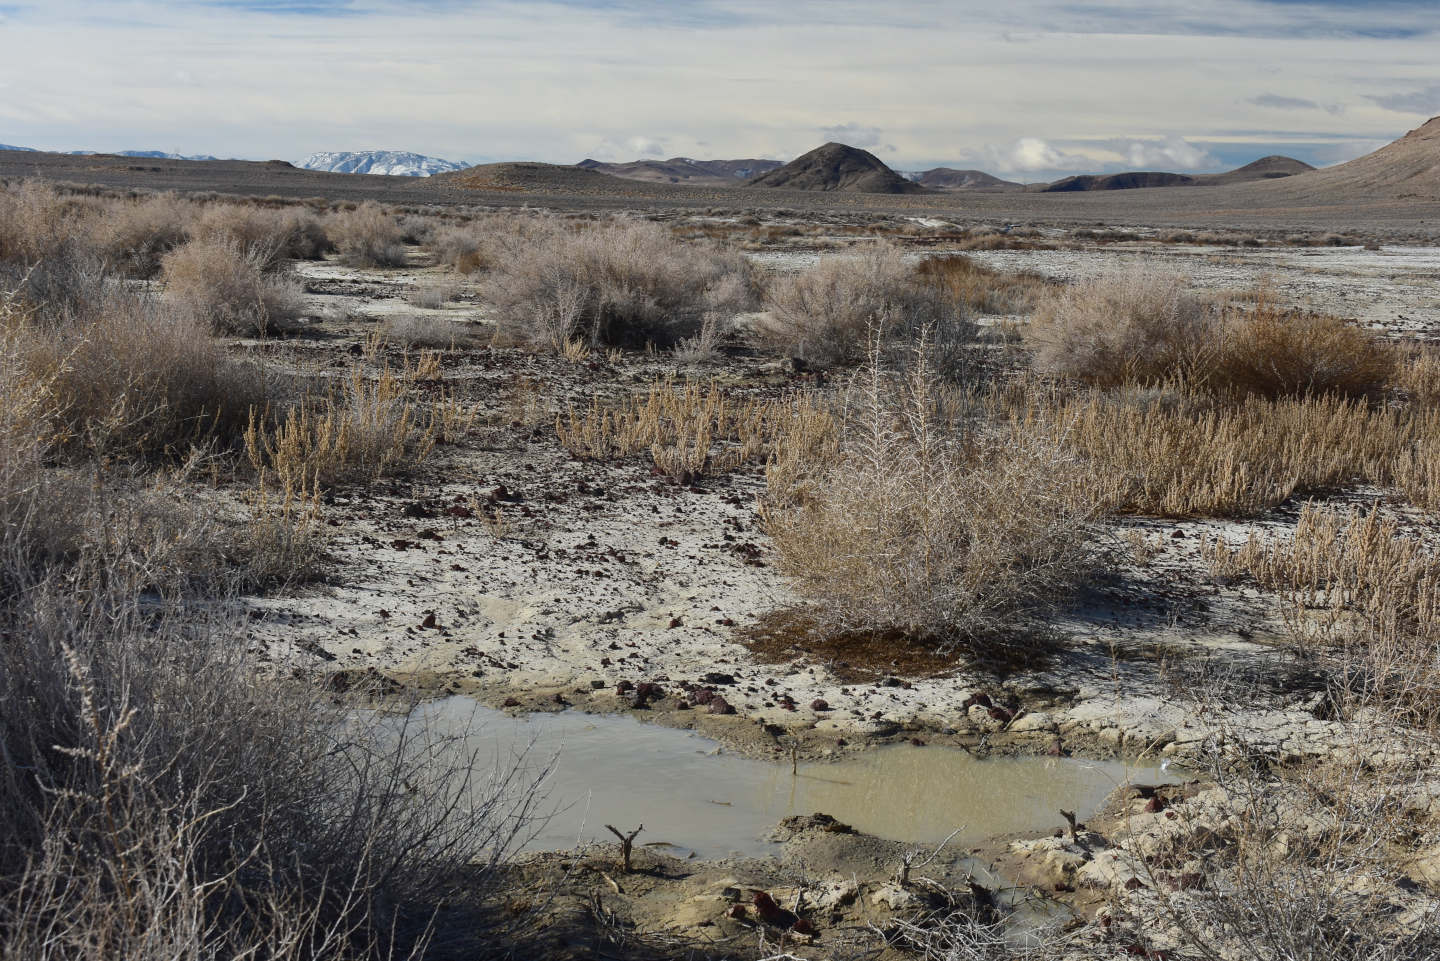
Grimes Point West Pond is about 1.3 km (0.8 miles) southwest of the Grimes Point archaeological site, which is 14 km (8.7 miles) southeast of Fallon. It is on the northeast side of the road down the east side of “Carson Lake”. The 1:100,000-scale map shows a stippled area about 500 m (1,640′) across on the opposite side of the road and a little farther south. That area is playa that has significantly less brush than Grimes Point West Pond but it was dry in late January 2022. At the time of the late January 2022 visit, there was another pond on the northeast side of the road a couple of hundred meters (several hundred feet) to the southeast of Grimes Point West Pond but it was significantly smaller.
There is a rest area on US 50 adjacent to Grimes Point. A nature trail leads from the rest area to various pictographs which have been pecked onto the black boulders.
Grimes Point West Pond is easily accessible by most passenger vehicles. To reach the pond, turn west off US 50 instead of east to the Grimes Point rest area. This intersection is about 10 miles east of the junction of US 95 South (Taylor Street) and US 50 in downtown Fallon. About 1/2 mile from US 50 and before reaching the fence around Fallon Naval Air Station, turn south onto a gravel road. Ignore the numerous dirt tracks made by off-highway vehicles. The pond is about halfway between the road to Fallon Naval Air Station and Macari Lane, or about 1/2 mile from each. The pond can also be reached from the south by turning west off US 50 onto Macari Lane about 1/2 mile southeast of the Grimes Point rest area and then turning north at Macari East Stop Sign Pond (see below).
Elevation: 1,197 m (3,925′)
January 27, 2022
I was going to search for ponds along the road down the east side of “Carson Lake” but saw this pond before I had gone a mile. NPPWOPII.
- 70 m x 90 m (i.e., at least as big as on January 31); depth not estimated.
- Opaque brown water; completely covered by ice.
- Can’t see fairy shrimp beneath the ice.
- Can’t see anything else beneath the ice.
Looking northeast across Grimes Point West Pond with Lahontan Mountains in distance. Grimes Point is at the left end of the hills.
January 31, 2022
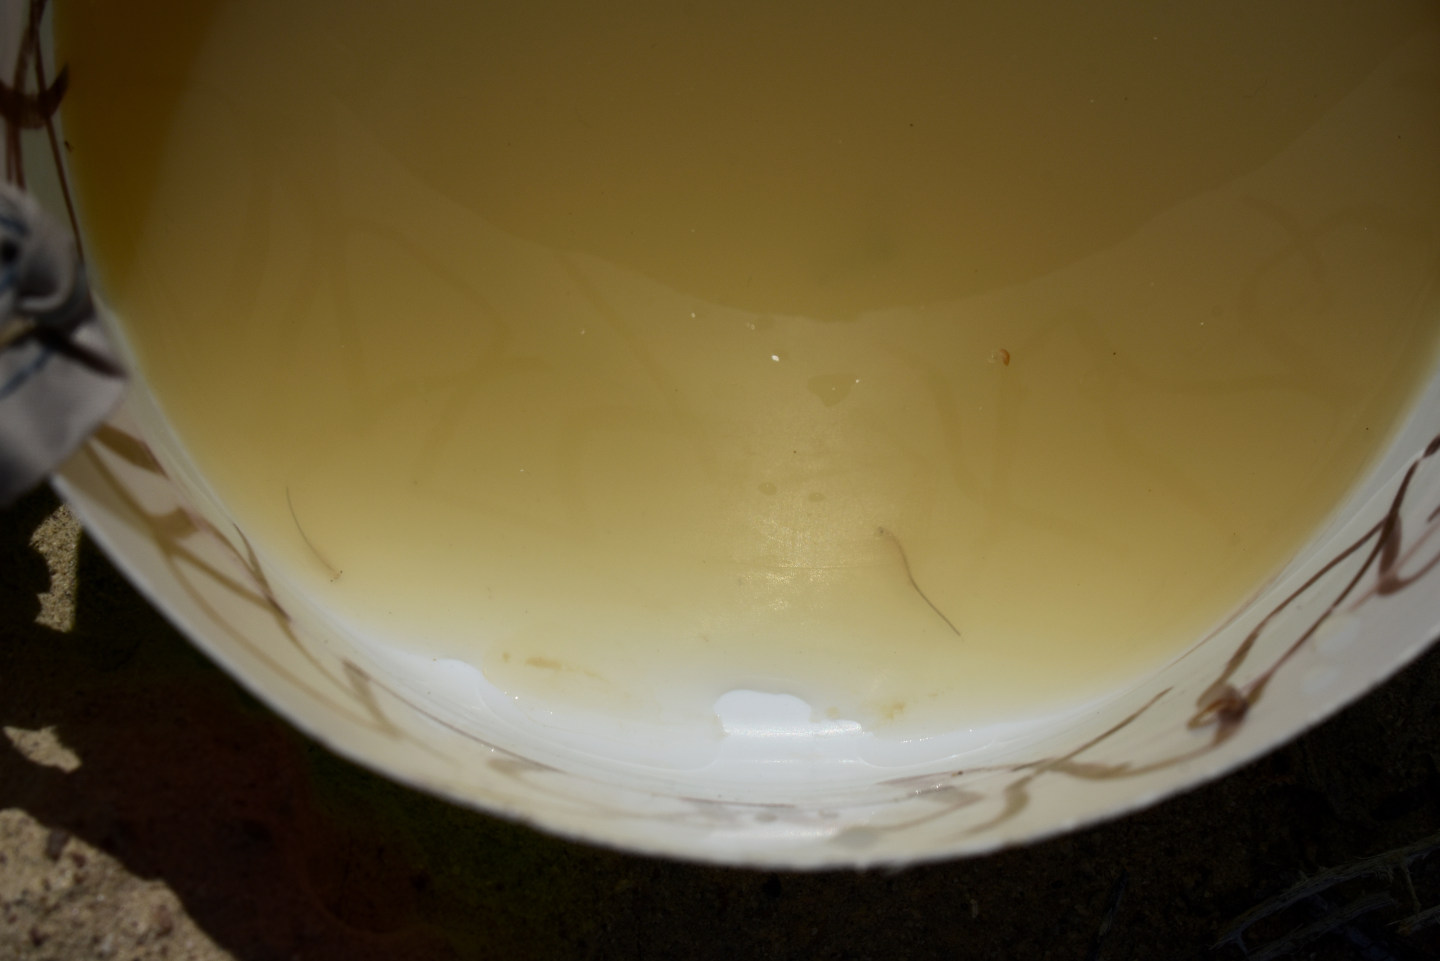
On the 27th, I didn’t have enough time to investigate Macari East Stop Sign Pond so I decided to have another look and came back to this pond too. Lucked out, as this time there was only minor ice remaining under the bushes. The water was surprising clear as I could see details on the bottom below 4 cm of water.
- 70 m x 90 m; mostly 3-4 cm depth but at least 6 cm and possibly 8 cm in spots.
- Murky brown water; 9 C in 2 cm water in shade at 1515.
- No fairy shrimp.
- No aquatic animals observed.
Looking northeast across Grimes Point West Pond in same view as photograph Grimes Point West Pond 2022-01-27, #01, but this time there is ice-free water. This pond has abundant brush on mounds throughout the pond.
Macari East Stop Sign Pond (Stillwater BLM Office)
Macari East Stop Sign Pond is 14.5 km (9 miles) southeast of Fallon on the southeast side of the intersection of Macari Lane and the road down the east side of “Carson Lake”. There is a stop sign on the east-side road. Macari Lane terminates at US 50 approximately 1 km (0.6 miles) to the northeast of the intersection. Remarkably, there is a street sign at that intersection so I have a name for the road. Except for the stop sign at US 50, the stop sign at the pond is the easternmost on Macari Lane. From the intersection, Macari Lane continues to the southwest and then turns westward to skirt the southern boundary of Fallon Naval Air Station. The 1:100,000-scale map shows a stippled area about 500 m across northwest of the intersection at the pond (same as that mentioned for Grimes Point West Pond). That area is also playa but is not where water accumulated in late January 2022.
As described for Grimes Point West Pond, the Macari East Stop Sign Pond is easily accessible by most passenger vehicles. Macari Lane turns off US 50 about 1/2 mile southeast of the turn-off to the rest area at the Grimes Point archaeological site and about 10 1/2 miles from the intersection of US 95 South and US 50 in downtown Fallon.
Elevation: 1,197 m (3,625′)
January 27, 2022
After stopping at the iced over Grimes Point West Pond, I was glad to find mostly ice-free water here.
- 100 m x 150 m (i.e., at least as extensive as on January 31); didn’t wade out to deeper water to find depth.
- Cloudy pale brown water; minor ice under brush at edges.
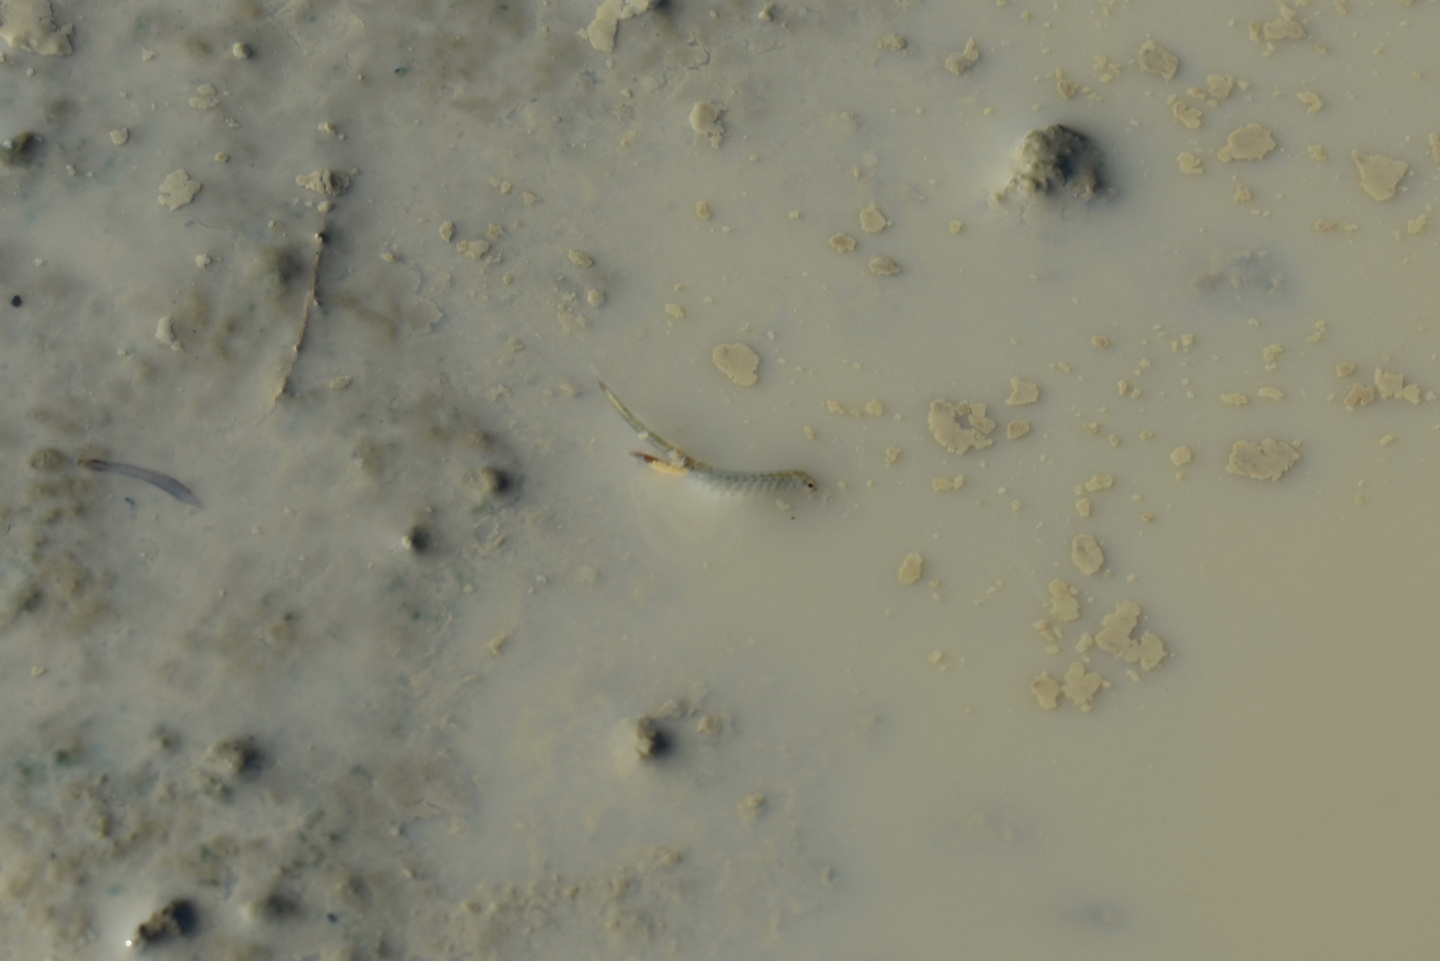
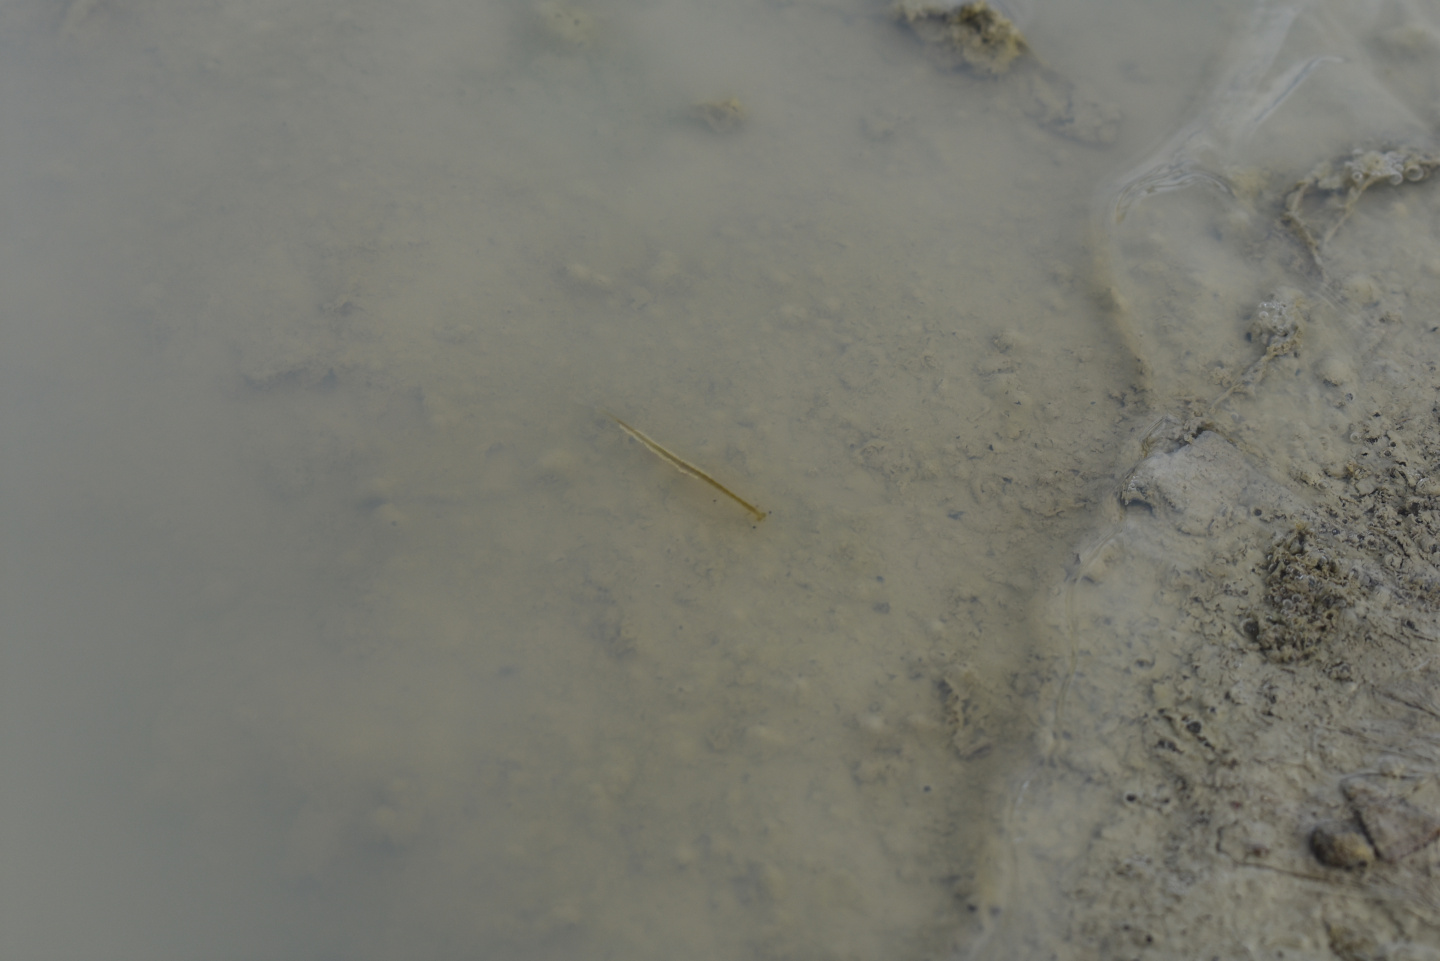
- Pale gray fairy shrimp about 20 mm long and a few distinctly smaller fairy shrimp; larger fairy shrimp have eggs.
- No other animals observed.
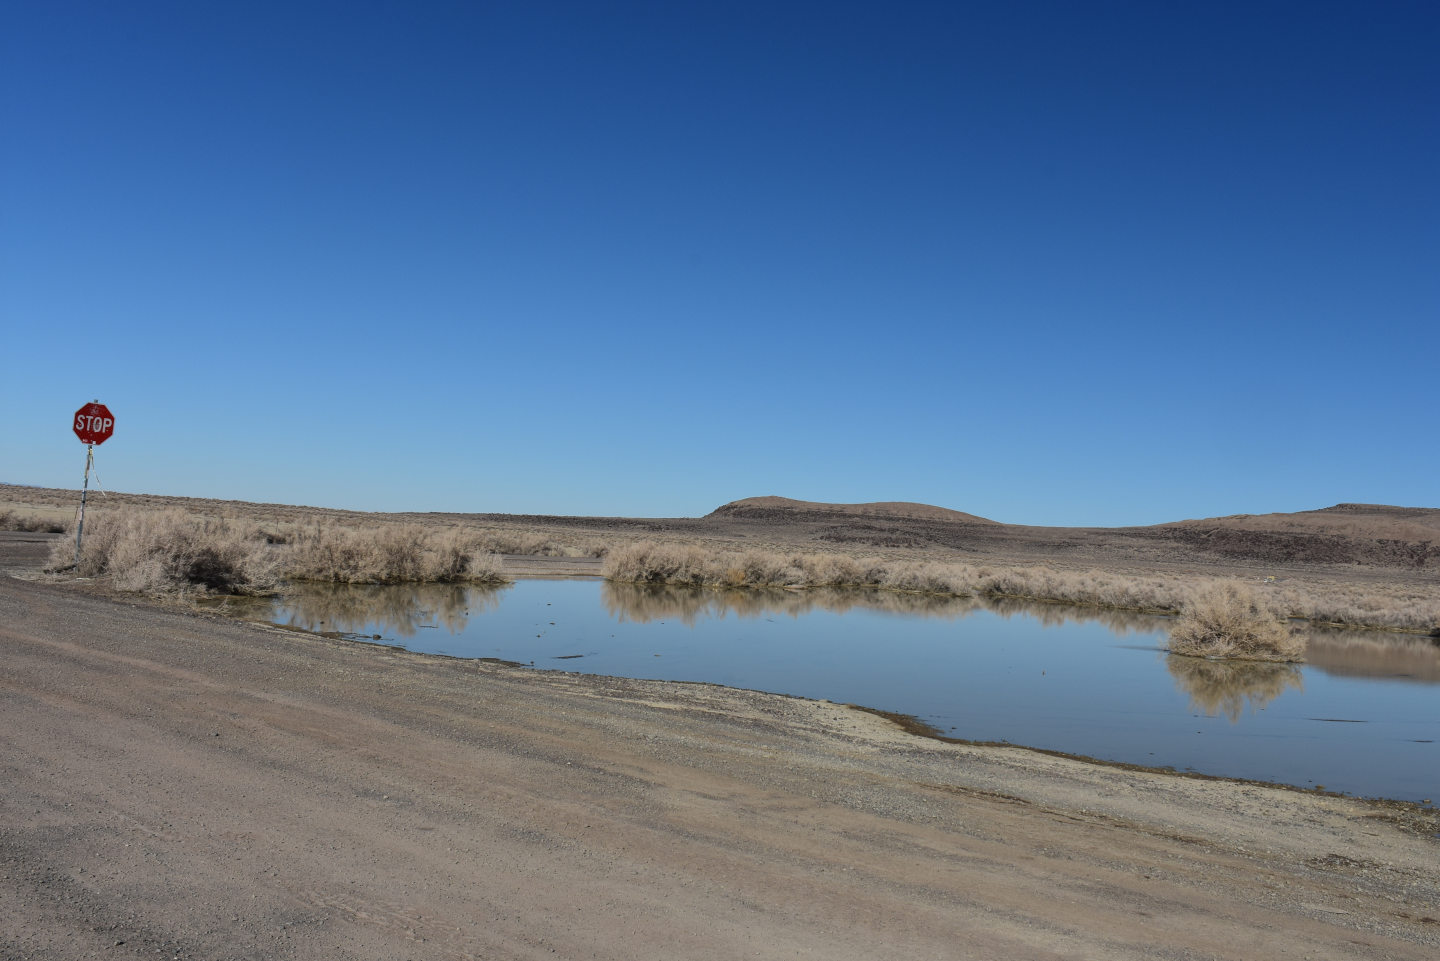
Looking northeast across Macari East Stop Sign Pond, with the Lahontan Mountains in the distance. The stop sign is at Macari Lane and the road in the foreground leads down the east side of “Carson Lake”.
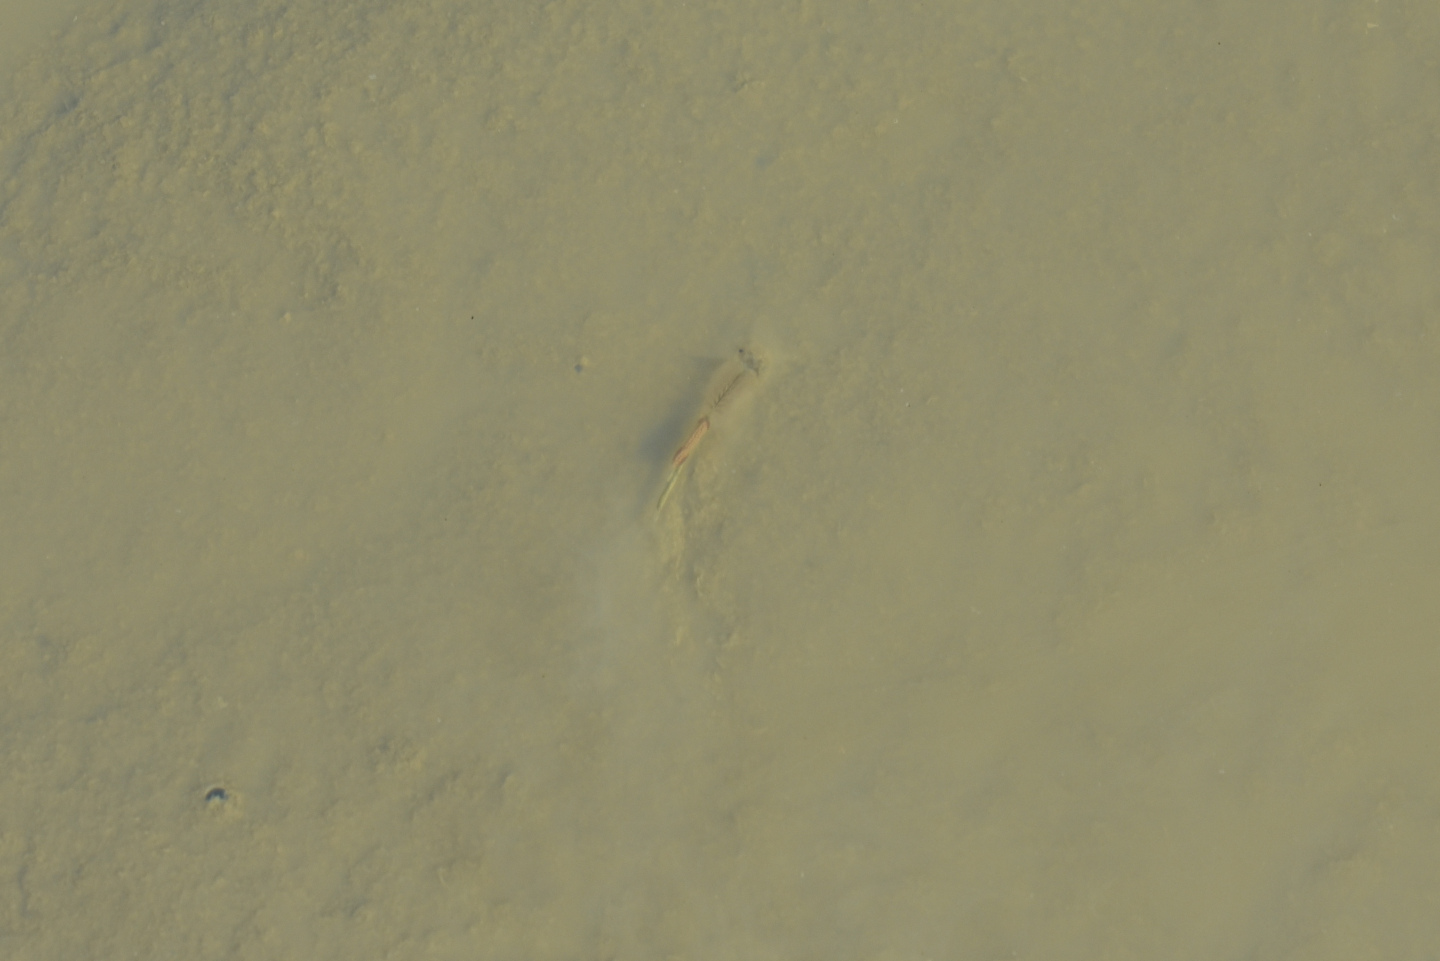
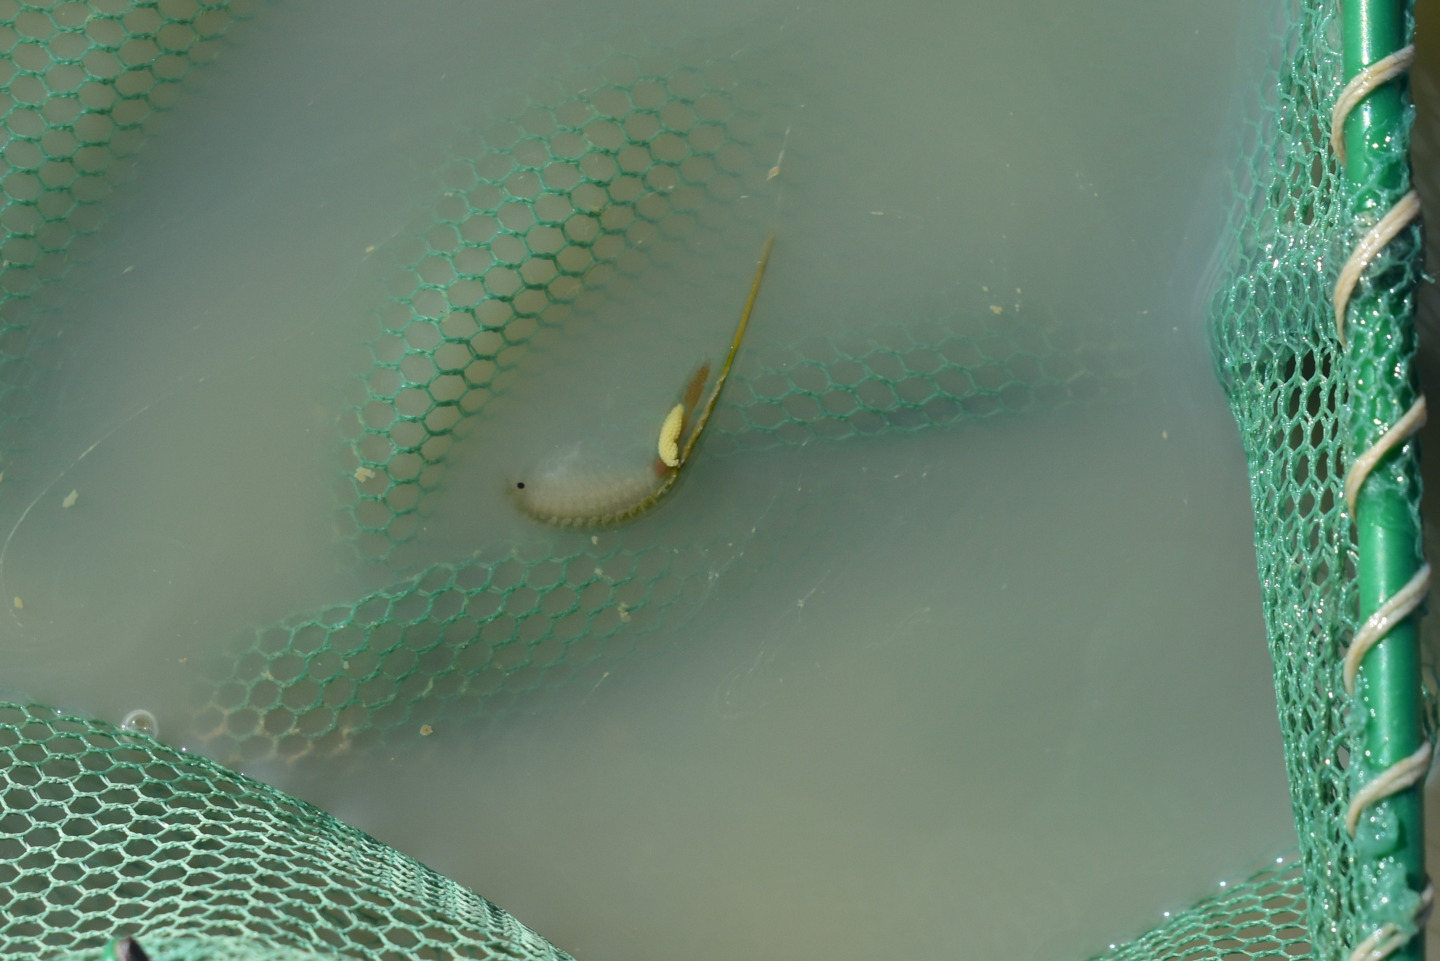
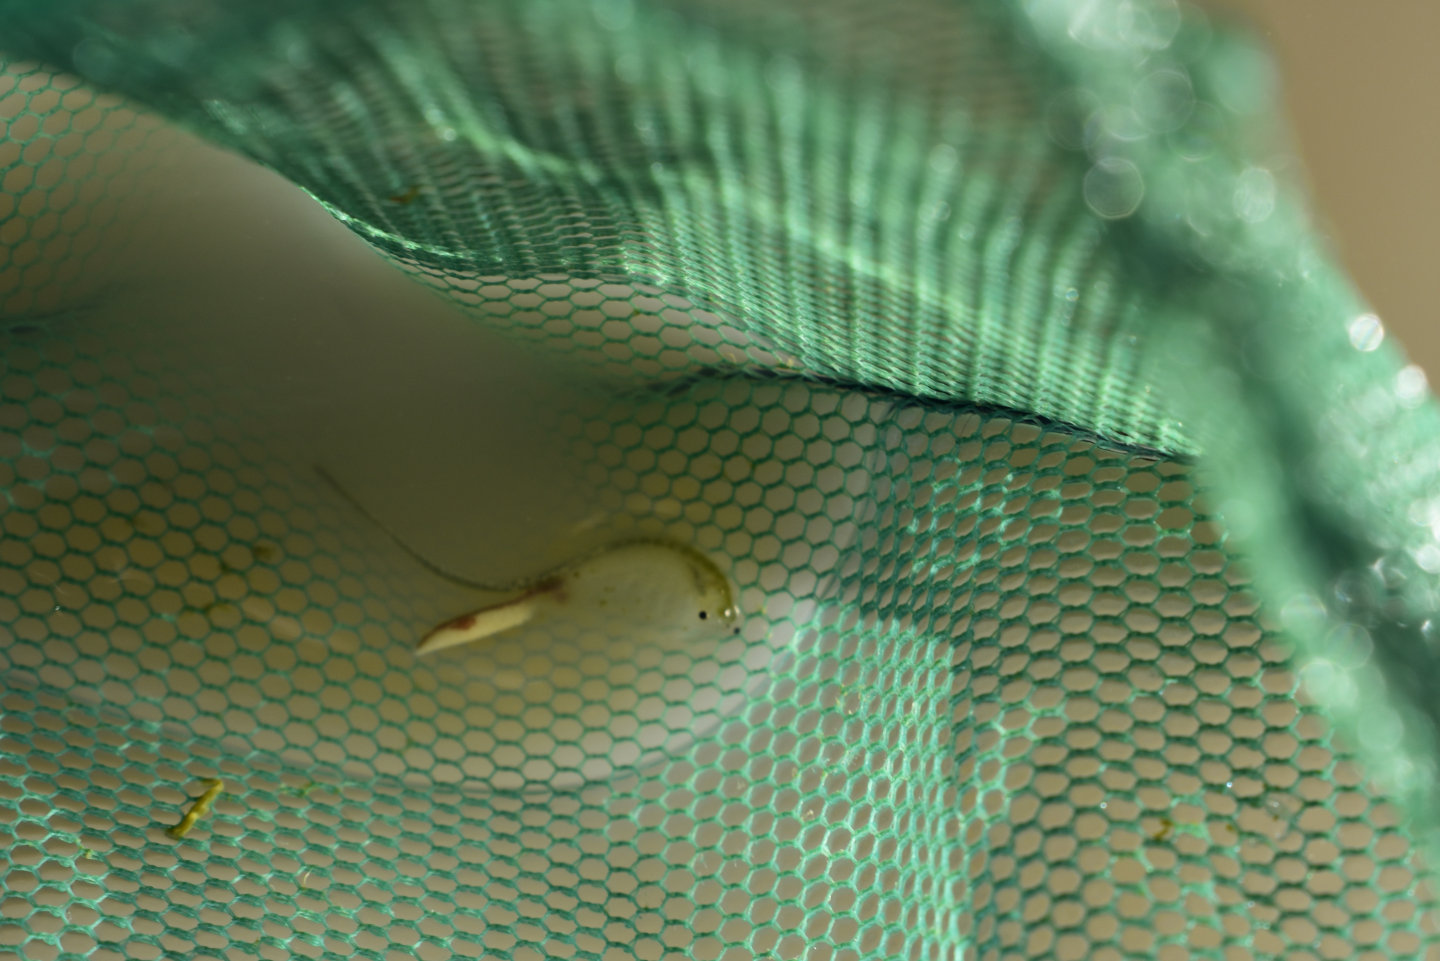
A female fairy shrimp with eggs in Macari East Stop Sign Pond. The fairy shrimp is skimming across the fluffy boundary layer of saturated clay at the bottom of the pond and occasionally churns up the clay, apparently for feeding purposes.
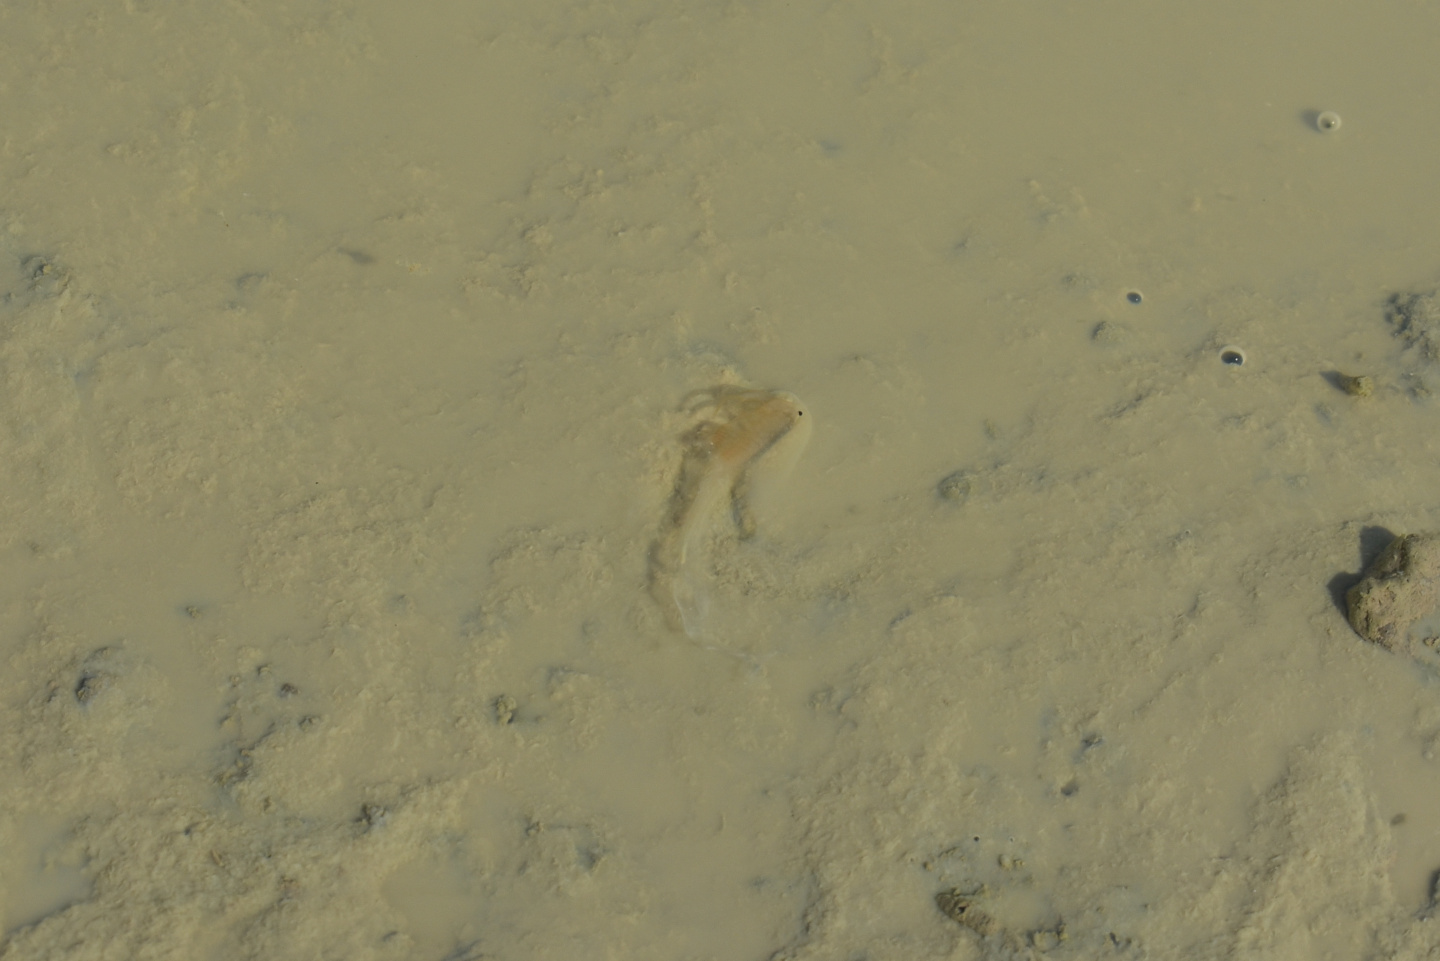
A male fairy shrimp in Macari East Stop Sign Pond. The fairy shrimp is swimming on its side skimming through the fluffy boundary layer of saturated clay at the bottom of the pond. There is a clayey bow wave against its head. The antennae II and their shadows show that they are almost 3/4 the length of the thorax and have a relatively simple structure of thick tubular basal segment and thin tubular distal segment with a blunt end. These antennae II are similar to those of the fairy shrimp in Stinking Springs Well Pond (Rawhide Flats), which also hatched this month and may be the same species (compare to Stinking Springs Well Pond 2022-01-13, #03c).
Macari East Stop Sign Pond Fairy Shrimp Video 2022-01-27r
For a 1-minute, 52-seconds video of a fairy shrimp swimming in very shallow, clear water at the edge of Macari East Stop Sign Pond on a calm day, click on the video player above. There is no audio. This reminds me, in an odd sort of way, of skiing bumps in deep powder and catching air. The yellowish eggs indicate this fairy shrimp is female. At 0:19-0:24 seconds, a much smaller fairy shrimp swims across the left half of the frame. Its shadow is more obvious and is well to the right of the star of the video. A male fairy shrimp swims by at 1:30.
January 31, 2022
I didn’t have enough time to fully investigate the fairy shrimp occurrence here on the 27th so I came back. Due to the shallowness of the water, I didn’t want to wait too long. Today has a stiff breeze that has churned up the clay in the water, unfortunately. Lots of noise from Navy jets (F-35s are really really loud) taking off and landing but they’re impressive.
- 100 m x 150 m; mostly less than 3 cm depth but at least 8 cm in some tire ruts, maybe up to 10 cm.
- Cloudy to opaque pale brown water; 5 C in shade at 1400, minor ice under brush at edges.
- Trimodal or more complex size distribution of fairy shrimp: about 20 mm long, 10-12 mm, less than 8 mm; larger females have eggs.
- Water boatmen (sub-order Heteroptera, family Corixidae) less than 10 mm long.
Looking northeast across Macari East Stop Sign Pond in the same view as photograph Macari East Stop Sign Pond 2022-01-27, #03, but not as wide angle. The clearly visible tire ruts indicate that there has been some water loss since the 27th, although overnight lows have been near -10 C (teens F) and highs near 8 C (40s F).
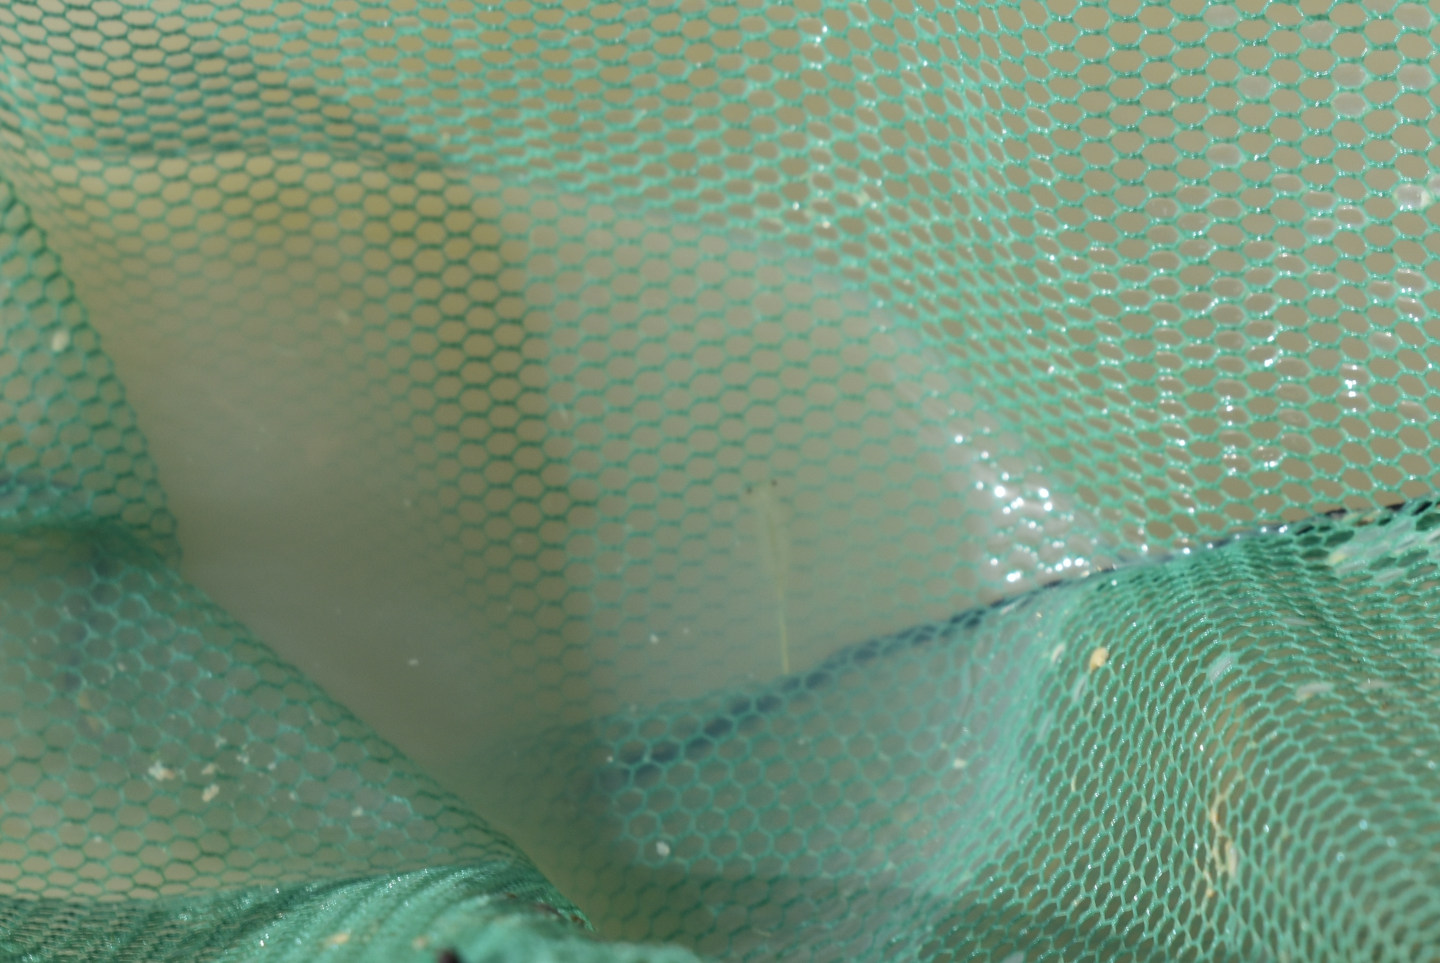
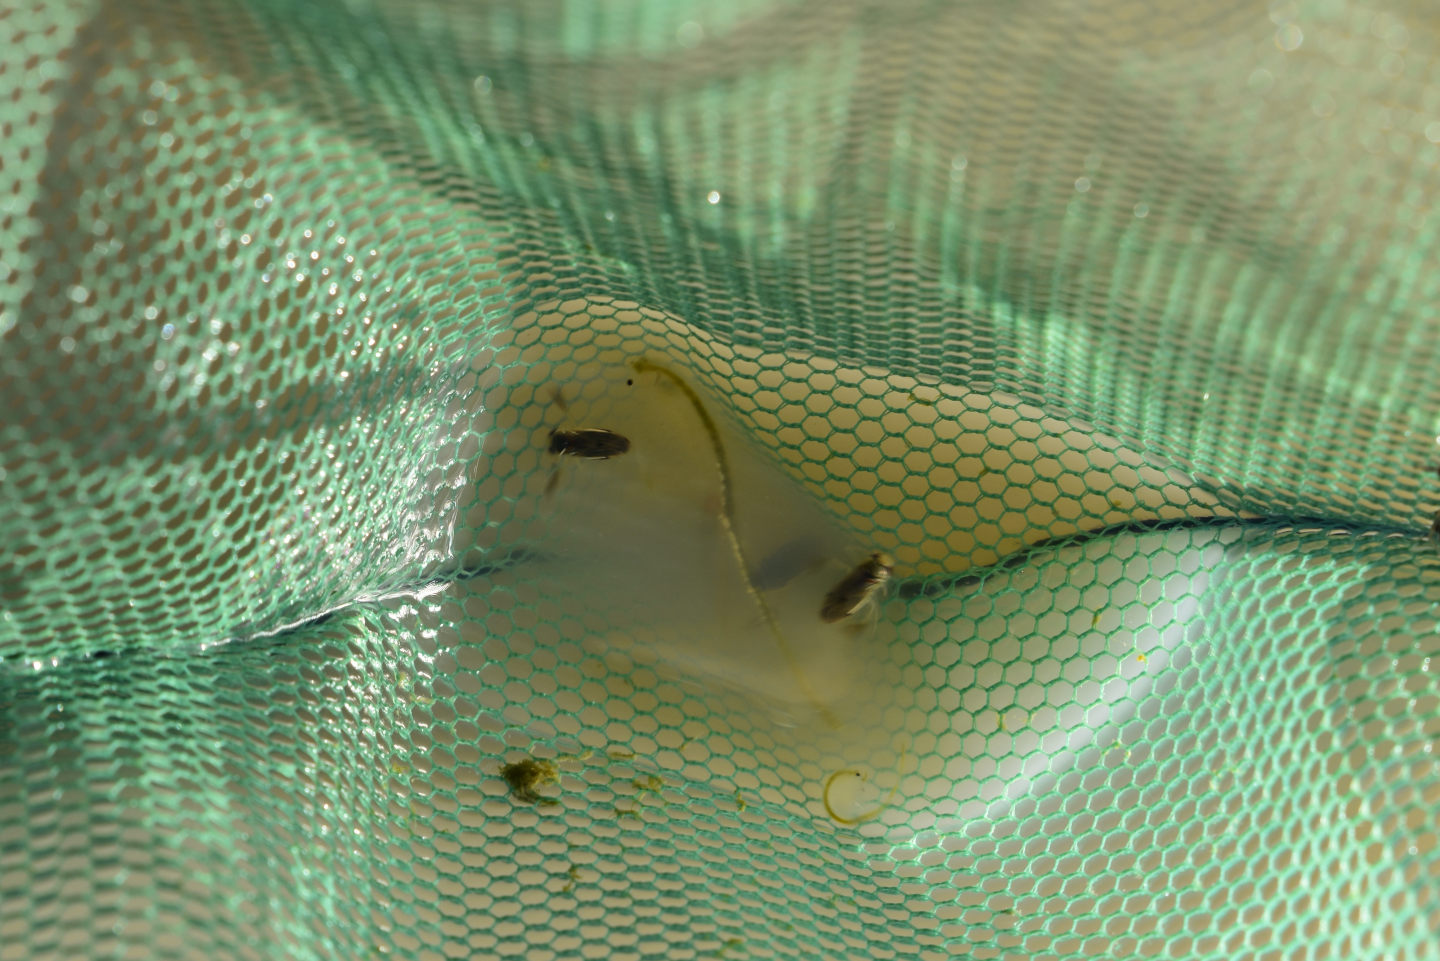
Female fairy shrimp in Macari East Stop Sign Pond with large cluster of very pale yellow eggs in the net. The eggs are all stuck together rather than spreading out to fill the ovisac. Is this what they look like just after they have been released by the ovaries?
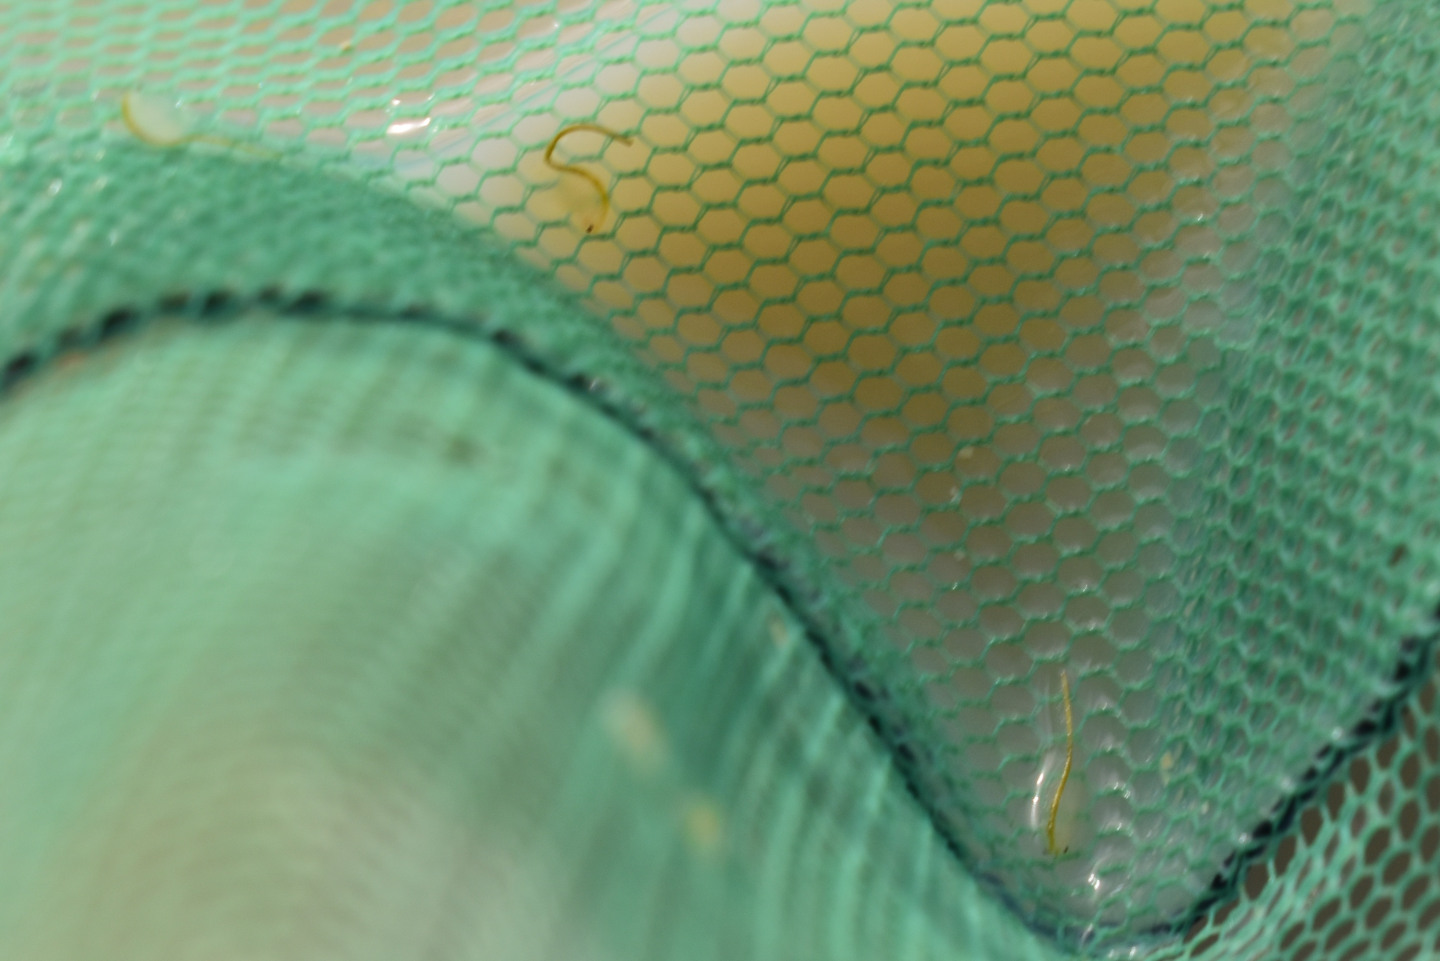
Smaller fairy shrimp in Macari East Stop Sign Pond. The net mesh openings are a little wider than 1 mm so these fairy shrimp (1 lower right, 2 upper left) are of the group less than 8 mm long. They must have hatched more recently than the 20 mm population. Another population is 10-12 mm but I wasn’t able to catch them in a photograph.
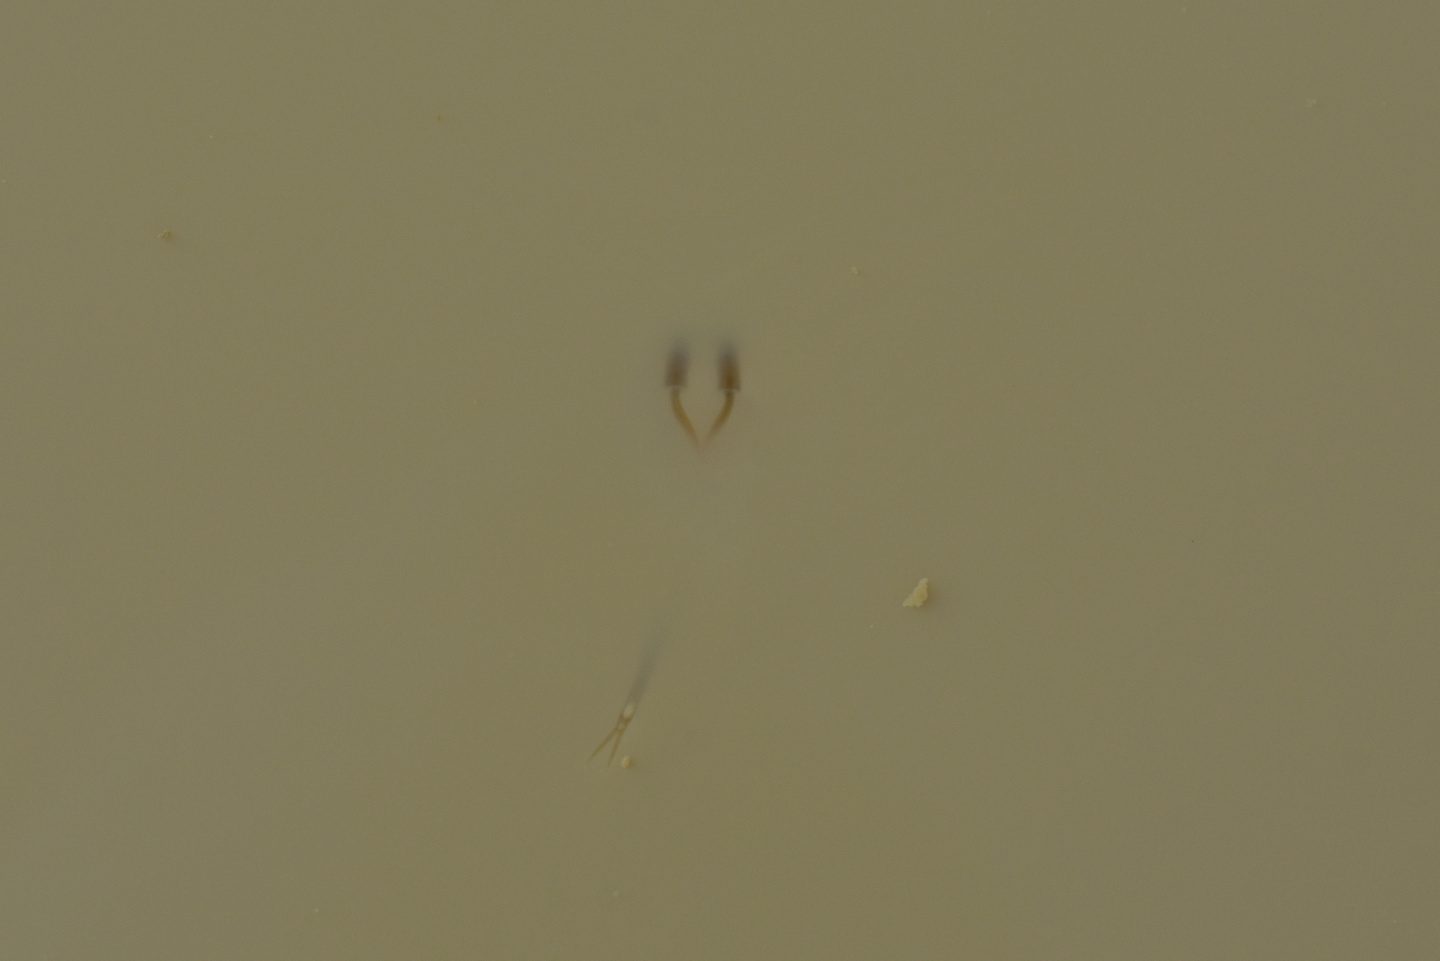
Male fairy shrimp in opaque water of Macari East Stop Sign Pond. The pair of antennae II (top) and cercopods (bottom) are skimming the water surface while the rest of the male fairy shrimp is invisible. More of this in Macari East Stop Sign Pond Fairy Shrimp Video 2022-01-31b-r.
Female fairy shrimp at the edge of Macari East Stop Sign Pond. This fairy shrimp is moving its legs but not moving forward. Is it basking in the afternoon warmth or is it stranded and doomed to die when the water freezes tonight? I saw several other fairy shrimp doing the same thing. They moved forward at times. Some would swim around a bit and then re-ground themselves in the very shallow water. I pushed a few into deeper water and some of those swam back to re-ground themselves, or pause, at the edge of the water. I haven’t seen any bodies in the mud but fairy shrimp bodies disappear rather quickly. That may mean the basking hypothesis is more likely. However, something similar occurred at Playa Wire Gate Pond on February 10, 2022 (Soda Spring Valley) and Stinking Springs Well Pond on February 23, 2022 (Rawhide Flats) and there some fairy shrimp did die in the mud.
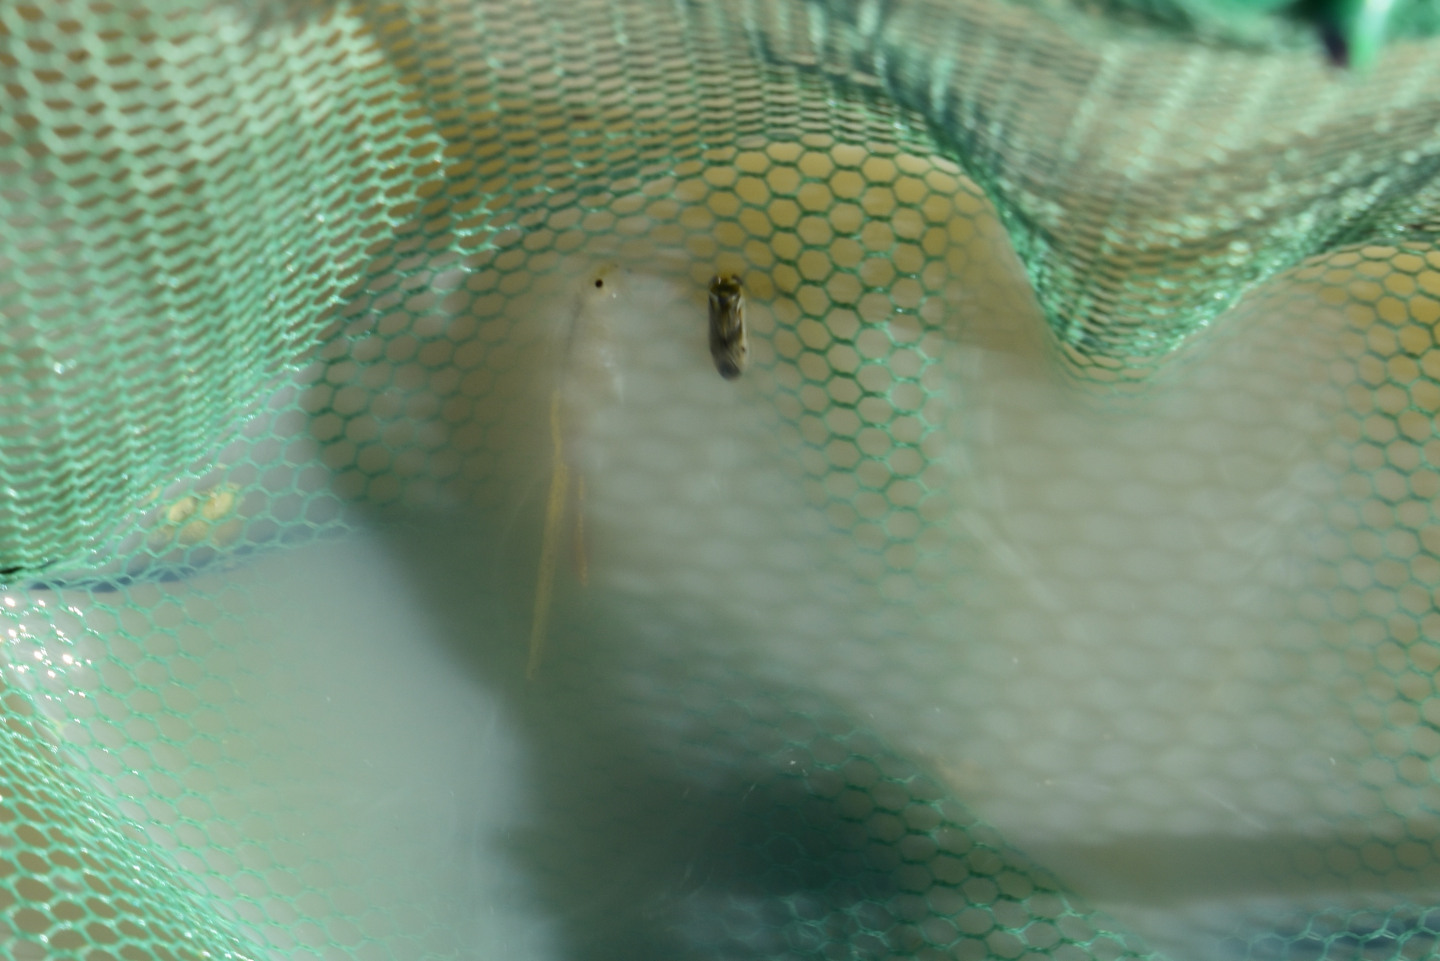
A female fairy shrimp (with eggs) and a water boatman (sub-order Heteroptera, family Corixidae) caught in the net at Macari East Stop Sign Pond. The water boatmen are also evidently adapted to winter living.
Macari East Stop Sign Pond Fairy Shrimp Video 2022-01-31a-r
For a 1-minute, 51-seconds video of a female fairy shrimp swimming in shallow, murky water of Macari East Stop Sign Pond, click on the video player above. There is no audio. In addition to the normal back-down posture, the fairy shrimp sometimes swims on its side or with its back up. The fairy shrimp seems intent on stirring up the clay, presumably for feeding purposes. At times, the legs churn rapidly but the fairy shrimp remains almost stationary. This is likely another feeding behavior. Do these apparently intensive feeding behaviors indicate food scarcity, an effort to maximize food collection during the ice-free period, or just the usual? What is the purpose of the occasional jerks? Semi-automatic defensive maneuvers, standard method to quickly reverse direction of motion, cleaning an accumulation of clay from between the legs? Fairy shrimp in Beauty Peak East Pond Fairy Shrimp Video 2021-04-30c-f (Bodie Hills) execute similar jerks.
Macari East Stop Sign Pond Fairy Shrimp Video 2022-01-31b-r
For a 60-seconds video of a male fairy shrimp swimming in Macari East Stop Sign Pond, click on the video player above. There is no audio. The water is so opaque that only pairs of antennae II and, occasionally, the cercopods at the end of the abdomen are visible. The antennae II are simple features with fat, tubular basal segments and thin, slightly curved, tubular distal segments, which touch or cross over the body’s center-line. The basal segments skim across the surface of the water like little motorized pontoon boats. At times, the rippling legs can be seen. Like the female in video Macari East Stop Sign Pond Fairy Shrimp Video 2022-01-31a-r, this fairy shrimp seems to be moving its legs more rapidly than needed for motion in an intense feeding effort.
There are also fairy shrimp in a pair of deep ruts in the road adjacent to the pond.
Why does Macari East Stop Sign Pond have fairy shrimp and Grimes Point West Pond 1 km (0.6 miles) away does not? Considering the proximity and the likelihood of wind-blown eggs, an absence of eggs at Grimes Point West Pond doesn’t seem likely. An answer can’t be provided here but there are some notable differences between the ponds. The floor of Grimes Point West Pond is relatively firm while that of Macari East Stop Sign Pond is very soft and sticky in spots. Grimes Point West Pond is smaller but may have a deeper average depth than Macari East Stop Sign Pond. Grimes Point West Pond has brush throughout whereas Macari East Stop Sign Pond does not. Grimes Point West Pond was frozen over at the time of the visit on January 27th when Macari East Stop Sign Pond was mostly free of ice. The facts that ice persists around the bases of the bushes due to shading and that there are many more bushes in Grimes Point West Pond may account for the persistence of ice longer on Grimes Point West Pond. That in turn could have blocked a temperature trigger for hatching even though Grimes Point West Pond was up to 9 C and warmer than Macari East Stop Sign Pond on January 31. For that to be the case, the temperature trigger would have to be a temperature integrated over a period of time rather than an instantaneous threshold, e.g., 8 hours above 5 C rather than an exceedance of 7 C. Whatever the trigger was, it happened more than once at Macari East Stop Sign Pond as there are 3 generations, by size, there. Although many experiments have shown that the hatching of resting eggs is sensitive to temperature, (see “Temperature” under “Habitats” and “Resting Eggs” on the Biology of Anostraca page), how do the resting eggs “know” when the time has come?
March 17, 2023
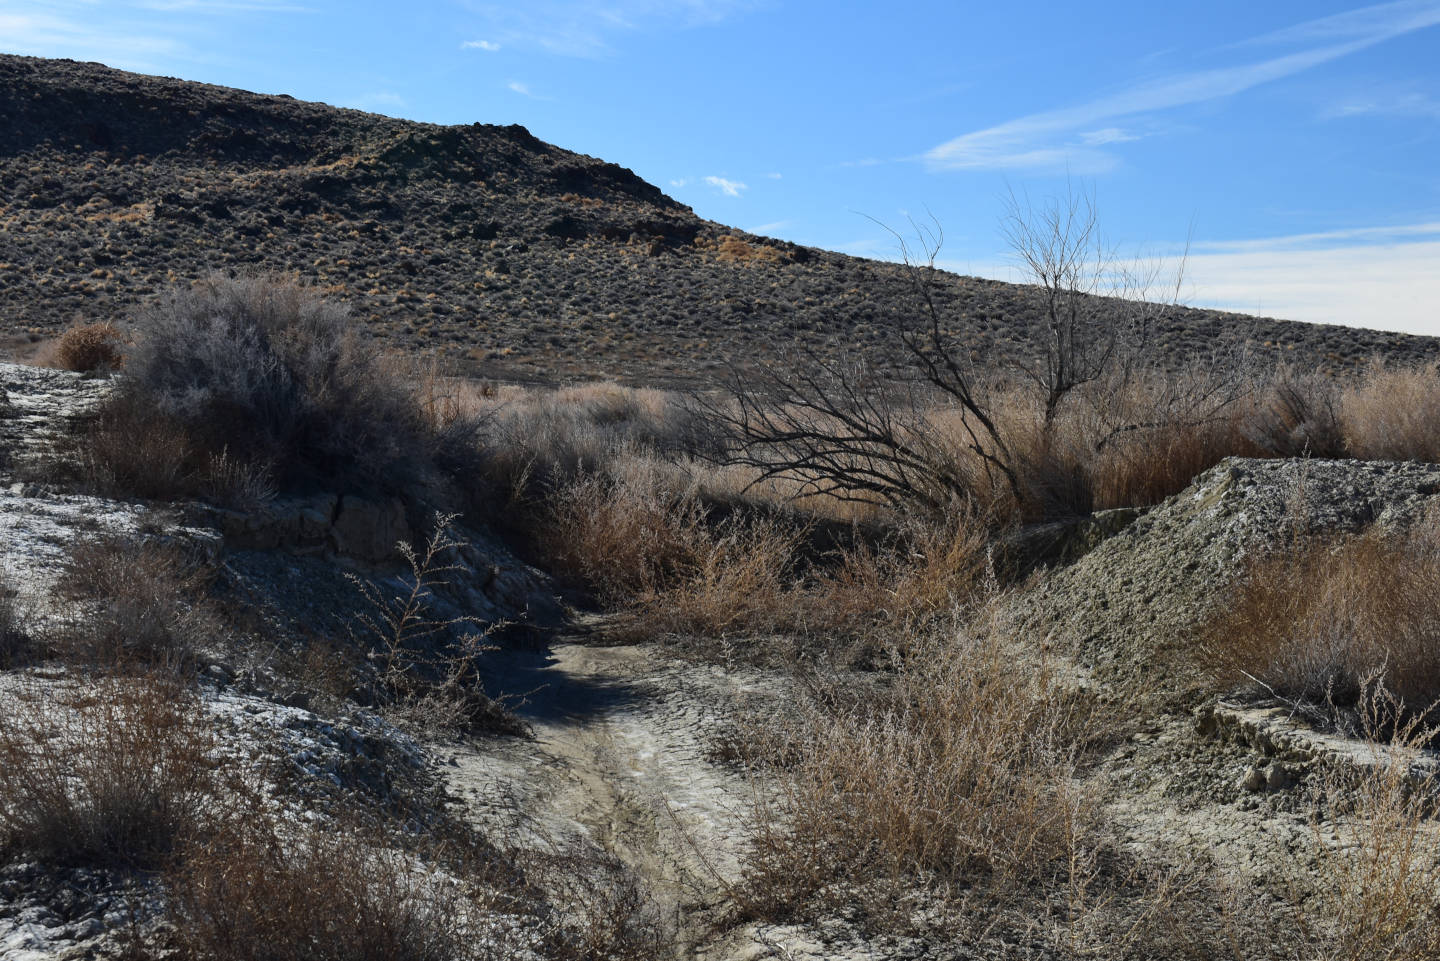
There were several excavators and other equipment working in the canal under US 50 about a mile northwest of the Grimes Point rest area (Lower Diagonal Drain?). The county may be enlarging it to handle a higher anticipated volume of spills from “Lahontan Reservoir” as a result of near record Sierra Nevada snow packs. There’s a “road closed” sign on US 50 for Macari Lane and a barrier across the road by the pond. Maybe the spills have already started and have flooded roads near “Carson Lake and Pasture”.
- Dry.
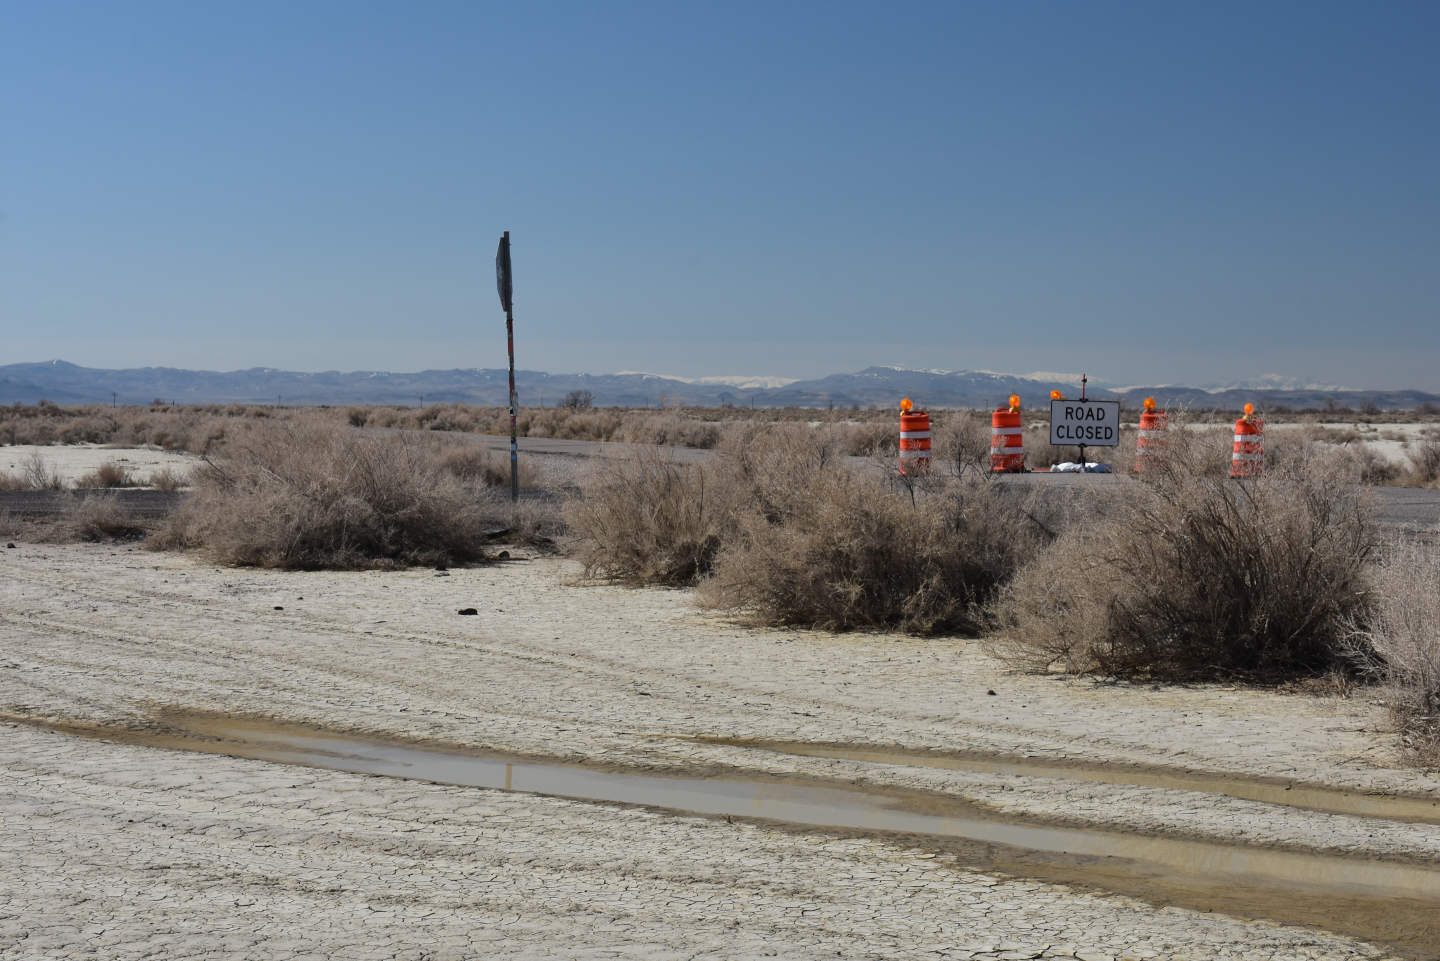
A dry Macari East Stop Sign Pond. Due to the wet winter, I had visions of extensive water on the playa around here in accordance with the intermittent lake symbol on the 1:100,000-scale BLM map. I guess the local precipitation wasn’t enough to offset evaporation. The “road closed” can’t be due to local snowmelt. If this pond is dry, it might be better to move on to Fairview Valley and cross my fingers.
“Carson Lake” East Ridge Pond (Nevada Department of Wildlife)
“Carson Lake” East Ridge Pond is approximately 17 km (11 miles) southeast of Fallon. It is about 1.5 km west of the small unnamed ridge which is on the east side of “Carson Lake” north of the Bunejug Mountains and which separates the “Carson Lake” basin from the Salt Wells basin. The pond is visible from this ridge. A graveled road passes adjacent to the pond on its way into the northern part of “Carson Lake”. There is a telemetered well adjacent to the road immediately west of the pond. This may be the “geothermal well” shown on the “Carson Lake” 7.5-minute topographic quadrangle. However, the well casing appears to be no more than 6 inches in diameter so the well could be an abandoned water well (but there are no stock tanks nearby) that is now used to monitor water levels.
To reach “Carson Lake” East Ridge Pond, turn west off US 50 about 1/2 mile southeast of the turn-off to the Grimes Point rest area, or 10 1/2 miles east of downtown Fallon, onto Macari Lane. After about a mile, turn south off Macari Lane at the stop sign by Macari East Stop Sign Pond and follow the gravel road down the east side of “Carson Lake”. Turn west onto another gravel road about 2 miles south of Macari Lane. There is a gate through a 5-wire fence. This is now State land managed by NDOW so I don’t know when it may be locked. The pond is on the south side of the road a little over 1/2 mile from the east-side road.
Elevation: 1,195 m (3,920′)
January 31, 2022
I walked up the small ridge on the east side of “Carson Lake” and peered into the setting sun hoping to get a glint of water from ponds out toward “Carson Lake”. I saw this one. I was unaware of the road to the pond but had an easy walk from the north end of the ridge.
- 30 m x 35 m; mostly less 4 cm depth but up to 8 cm in spots.
- Opaque brownish-gray water; 6 C in 1 cm water at 1645.
- Fairy shrimp less than 9 mm long.
- No other animals observed.
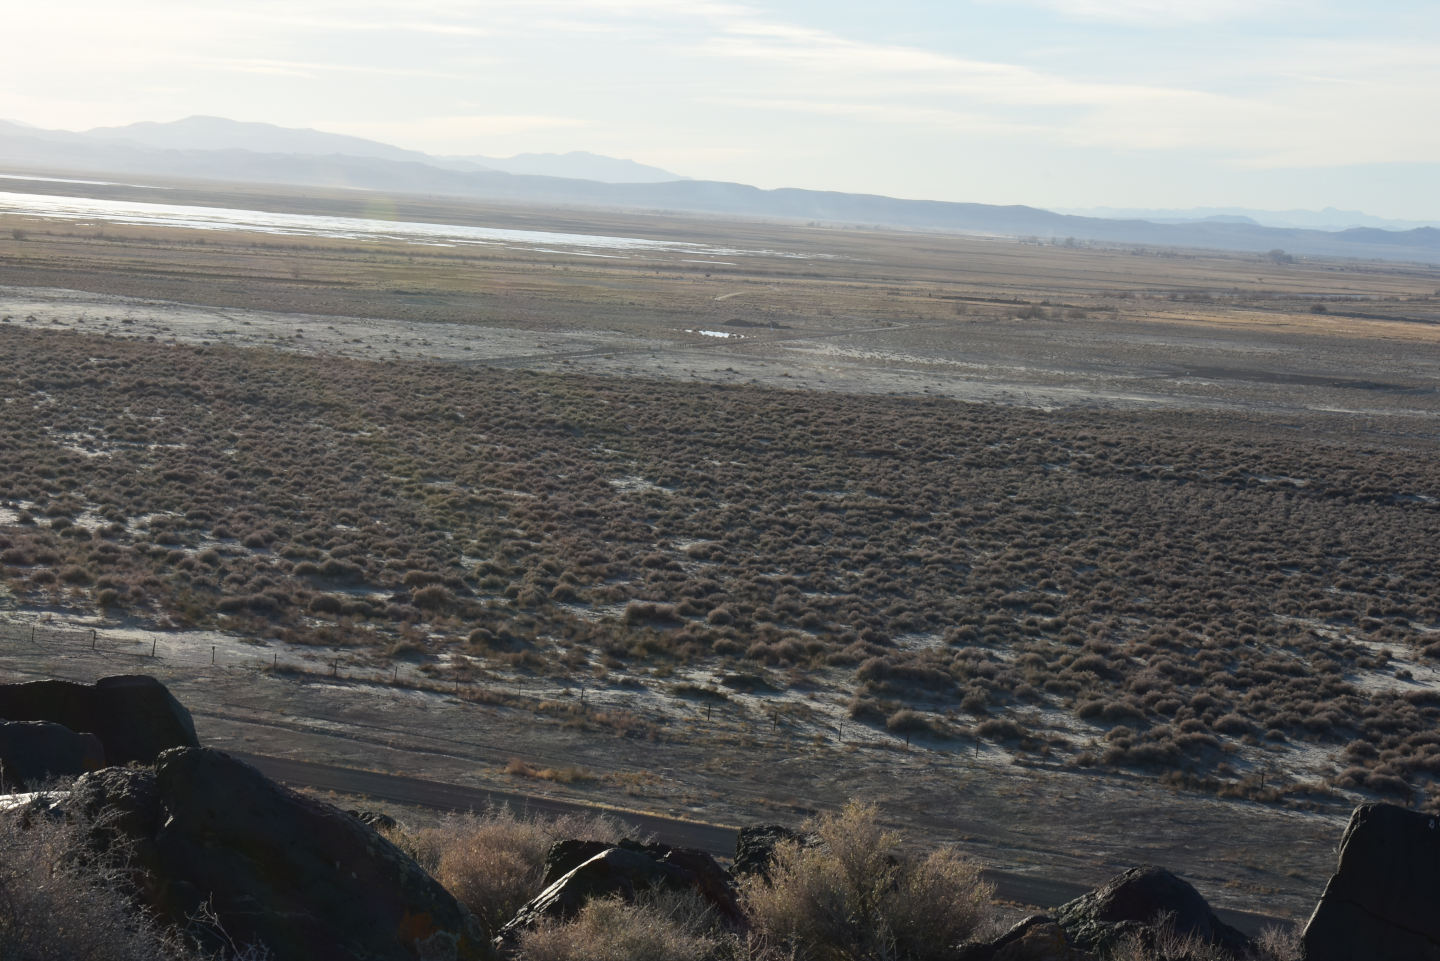
“Carson Lake” East Ridge Pond is the small reflection at center in this view from the small ridge east of “Carson Lake”. The extensive reflection at upper left may be water or ice in “Carson Lake”. With no irrigation return flows, the “wetlands” and “wet meadows” of NDOW’s “Carson Lake and Pasture” don’t look so wet now.
“Carson Lake” East Ridge Pond, looking southeast toward the Bunejug Mountains from the gravel road that passes by the pond. The low sun angle is great for landscape photographs but makes it almost too dark to see or photograph fairy shrimp.
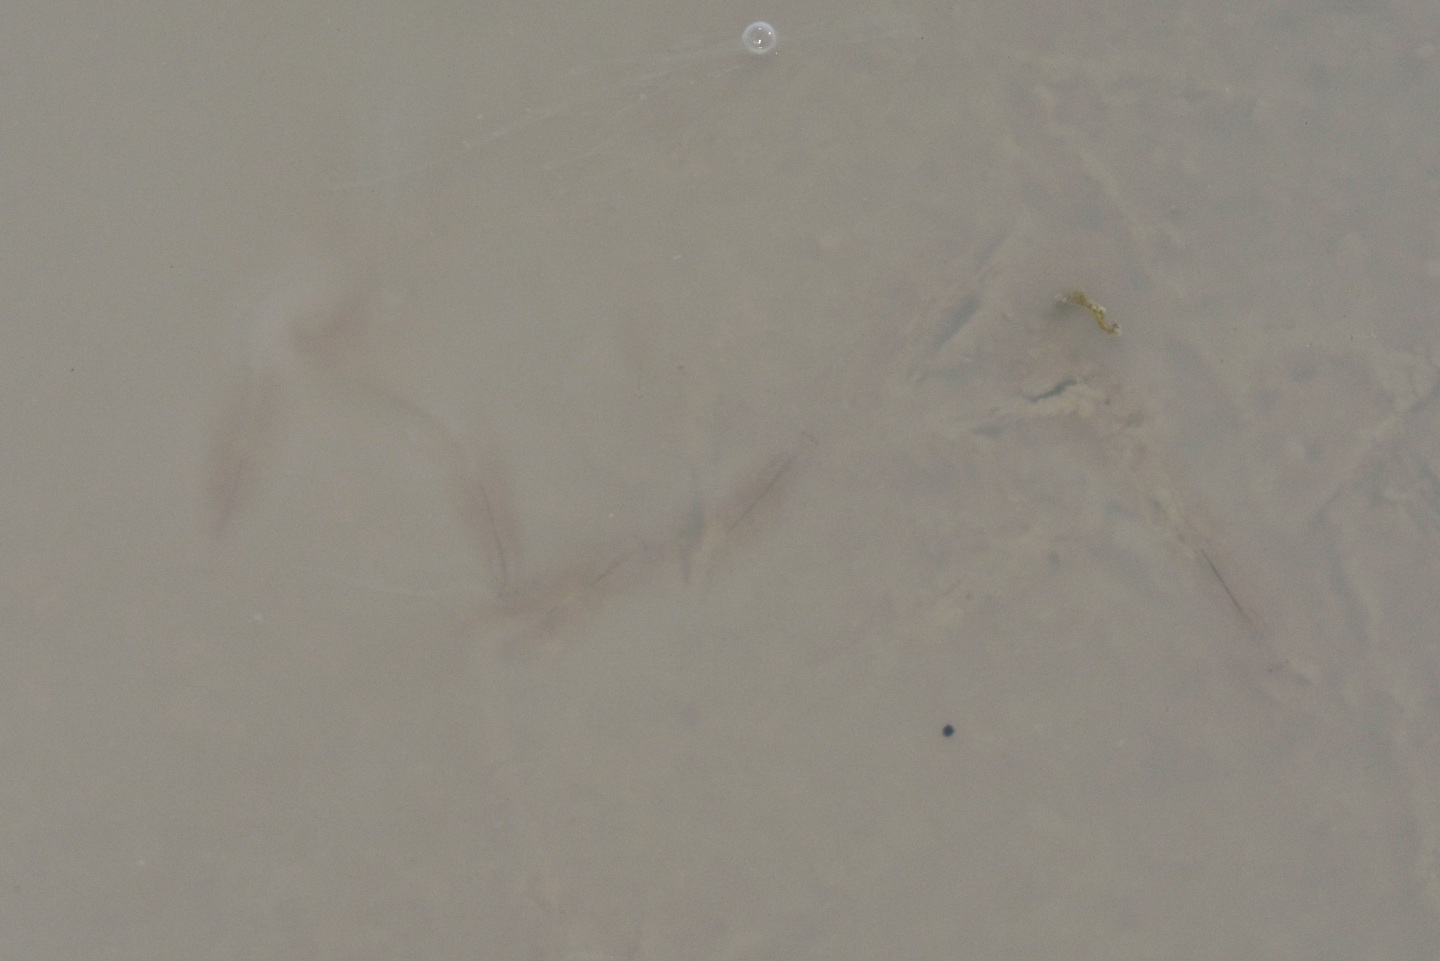
Fairy shrimp swimming in “Carson Lake” East Ridge Pond. Macari East Stop Sign Pond had been quite an eye opener with fairy shrimp diving into fluffy clay at the bottom of the pond and pairs of male antennae II scurrying around like little pontoon boots. But this? How do I describe this? The dark, elongated fuzz blobs are fairy shrimp swimming in the clay-water boundary layer, which starts near the surface. They have the graceful swimming motion of fairy shrimp but all you can see are the rippling traces of their passage. The burrowing sand worms on Arrakis have nothing on these dirt-swimming fairy shrimp; these are real. The contrast and brightness of the photo have been enhanced so that you can make out, barely, the dark, linear intestines of some of the fairy shrimp. 6-7 fairy shrimp are aligned in a fortuitous, sinusoidal, end-to-end pattern from the center to the left. The paler linear features, mostly at right, are probably twigs coated with clay. To watch the fairy shrimp swim, see the video below.
Fairy shrimp in net at “Carson Lake” East Ridge Pond. I apologize for the quality of the photograph but it’s the best I could do in the fading light. The camera’s automatic focus obviously didn’t work but, with the net in one hand and the camera in the other, I couldn’t manage manual focus. There is a recognizable fairy shrimp just to the right of center. This fairy shrimp is smaller than what I guessed from the size of the fuzz blobs in the clay, as shown in photograph “Carson Lake” East Ridge Pond 2022-01-31, #22c, but I couldn’t find any bigger ones, even when I tried to net the rippling fuzz blobs.
“Carson Lake” East Ridge Pond Fairy Shrimp Video 2022-01-31c
For a 1-minute, 16-seconds video of several fairy shrimp swimming in clay-rich water of “Carson Lake” East Ridge Pond, click on the video player above. There is no audio. The video hasn’t been slowed down; the fairy shrimp really are swimming slower than what I usually see. These fairy shrimp are in a tire rut between the road and the pond itself. Clay contrails, a jerk and a puff of clay like a smoke ring hanging in the air, bow waves of clay pushed in front of the head, a flutter of the legs and another cloud of clay rises, such are the things I could never have imagined but the fairy shrimp have shown me. A day to remember.
If you doubt that this video shows fairy shrimp, have a look at the photos and videos for 2022-02-28 at Candelaria Playa Ponds (Candelaria Hills).
Bass Flat Southwest Pond (Stillwater BLM Office)
___This map is a screenshot of The National Map (Go to The National Map). The U.S. Geological Survey generally does not copyright or charge for its data or reports (unless printed). A pond location is indicated by an “X”, which corresponds to the coordinates given in the data spreadsheet. Labels in quotations are from 7.5-minute topographic quadrangles.
___Red lines are the U. S. National Grid with a spacing of 1,000 m and intersection labels consisting of the UTM zone (e.g., 11S, 12T), a 2-letter 100-km square designation (e.g., LC, XN), and a 4-digit number. The first 2 digits of the number represent the 1,000-meter Easting and the second 2 digits the 1,000-meter Northing, as seen in the example Easting and Northing. Unlike latitude and longitude, the National Grid is rectilinear on a flat map, the units of abscissa and ordinate have equal lengths, and the units (meters) are measurable on the ground with a tape or by pacing.
___Gray shading represents private land as traced from the PAD-US 2.0 – Federal Fee Managers layer of The National Map.
___State land of Carson Lake and Pasture is not delineated but covers the area west of about Easting 358,500, north of about Northing 4,348,000, and east of US 95. Other lands are public.
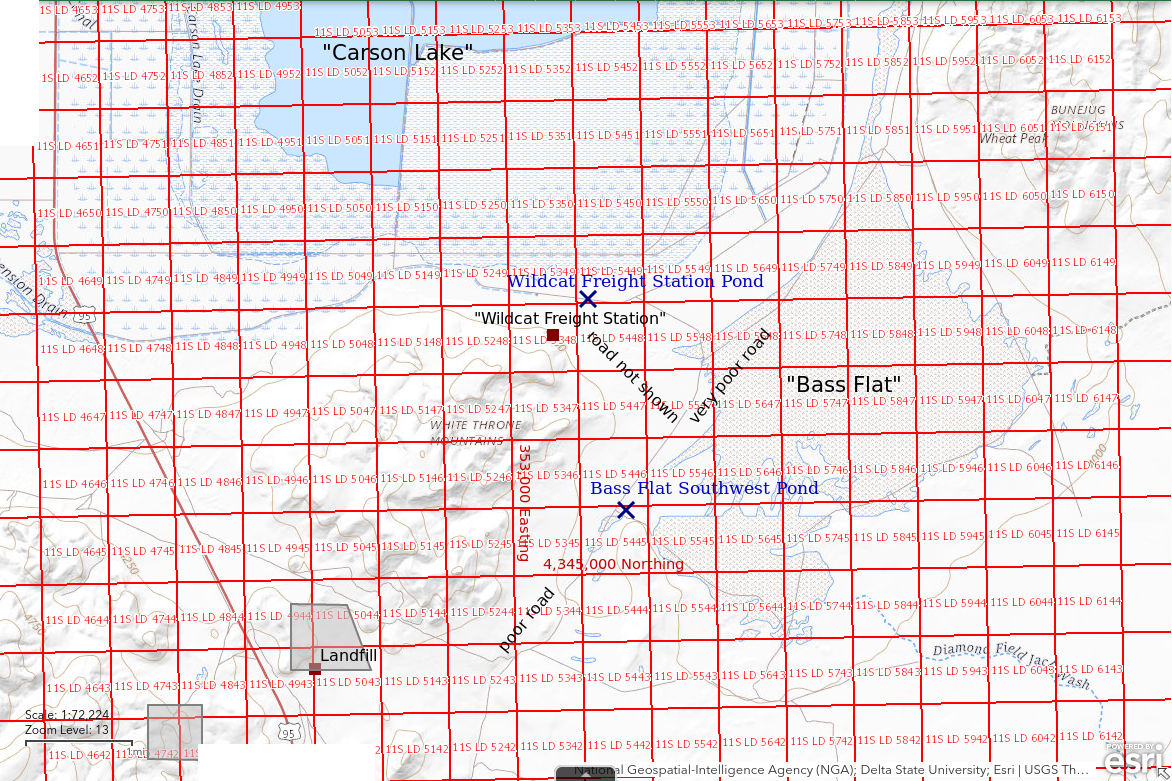
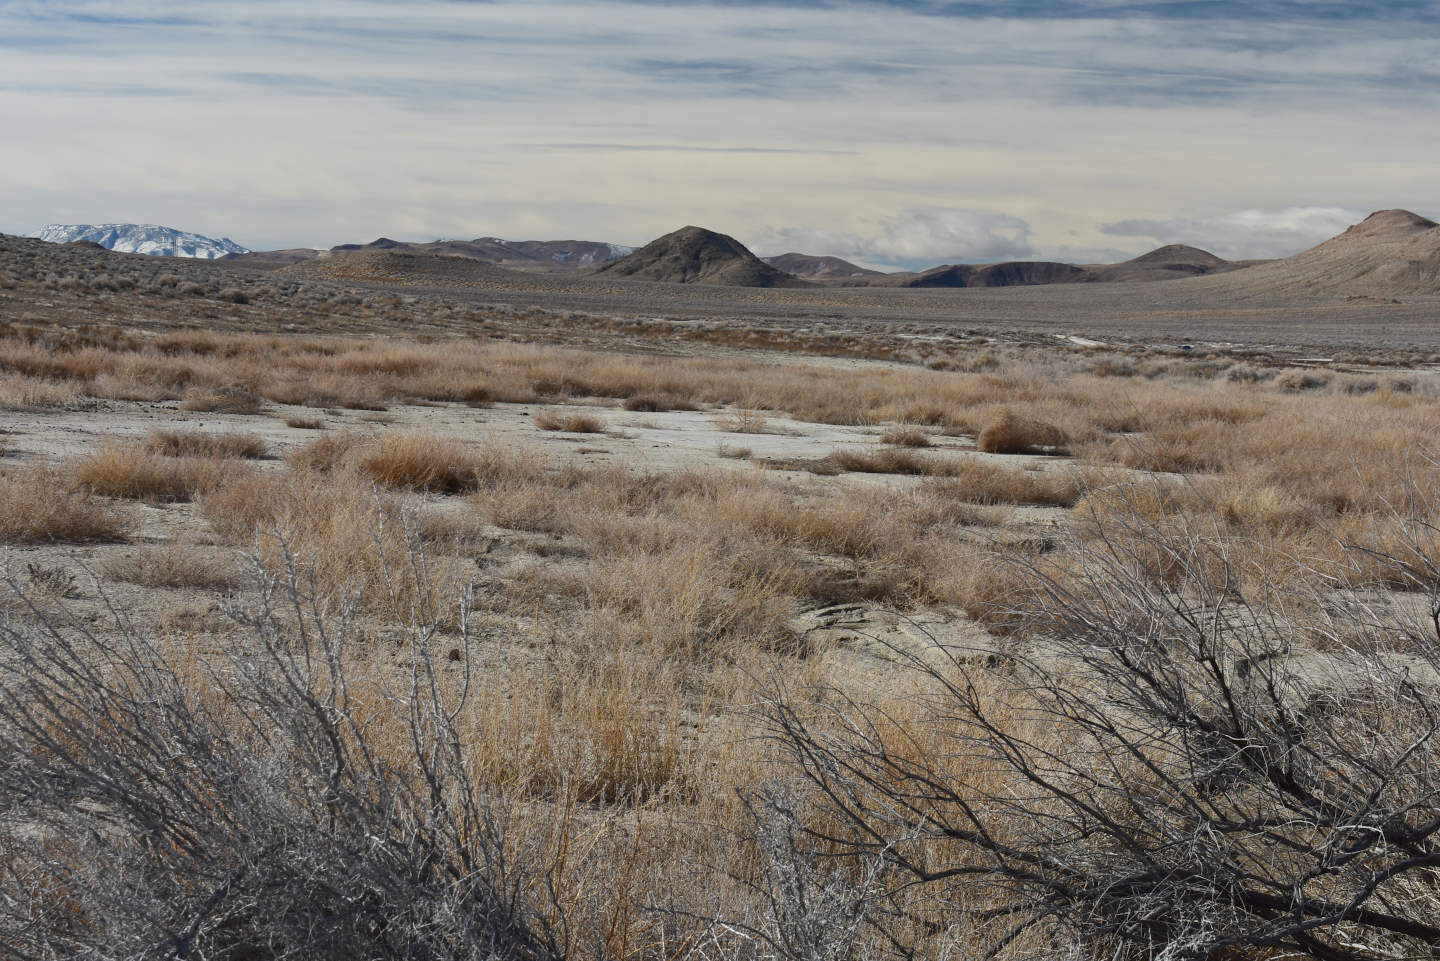
Bass Flat Southwest Pond is about 26 km (16 miles) south of Fallon. It is in the southwestern part of Bass Flat near the northern tip of a small ridge. Bass Flat is a playa about 8 km (5 miles) in diameter that forms a lobe off the southeast end of “Carson Lake”. A linear dike on the north side of the pond indicates it was constructed as a stock pond. There is no evidence of recent intense cattle trampling. The pond is not shown on the “Carson Lake” 7.5-minute topographic quadrangle. The adjacent Allen Springs quadrangle has a narrow, 200-m long stippled area southwest of the Y intersection to the southwest of the pond. This area did not have water on February 9, 2022 when the pond did. It is doubtful that the stipple is a mislocated Bass Flat Southwest Pond. The Bass Flat Southwest Pond could be younger than the 1974 or 1981 aerial photographs (depending on which vintage covered the current pond location) used to prepare the 1985 edition of the “Carson Lake” quadrangle.
Bass Flat Southwest Pond is accessible via a poor road from the south. This road turns east off US 95 1.3 miles south of the turn-off to the Churchill County landfill. The road passes Lee Hot Springs about 1 mile from the highway and then turns north to follow a wash down to Bass Flat. The total distance is probably about 5 1/2 miles. The pond is northeast of the Y where a road branches to the east (right) to loop around the north end of the small ridge. The road which continues straight toward “Carson Lake” appears to be used less. Much of the road to the pond is on clay and should not be attempted when wet unless one is prepared for the consequences.
Elevation: 1,207 m (3,960′)
February 9, 2022
I turned right at the Y by the pond to follow the more recent tracks and wound up at the edge of the pond. I hiked up the adjacent hill for a look around and didn’t see any other ponds. The pond was almost entirely covered with ice when I arrived at about 1030. I stopped again at the pond on the way back from Wildcat Freight Station Pond to spend more time looking in the newly ice-free water.
- 60 m x 75 m; depth not estimated.
- Opaque pale brown water; 4 C in 2 cm water in sun at 1045.
- Most fairy shrimp 25-35 mm long but some about 10 mm; larger females have eggs.
- Water boatmen (sub-order Heteroptera, family Corixidae) less than 10 mm.
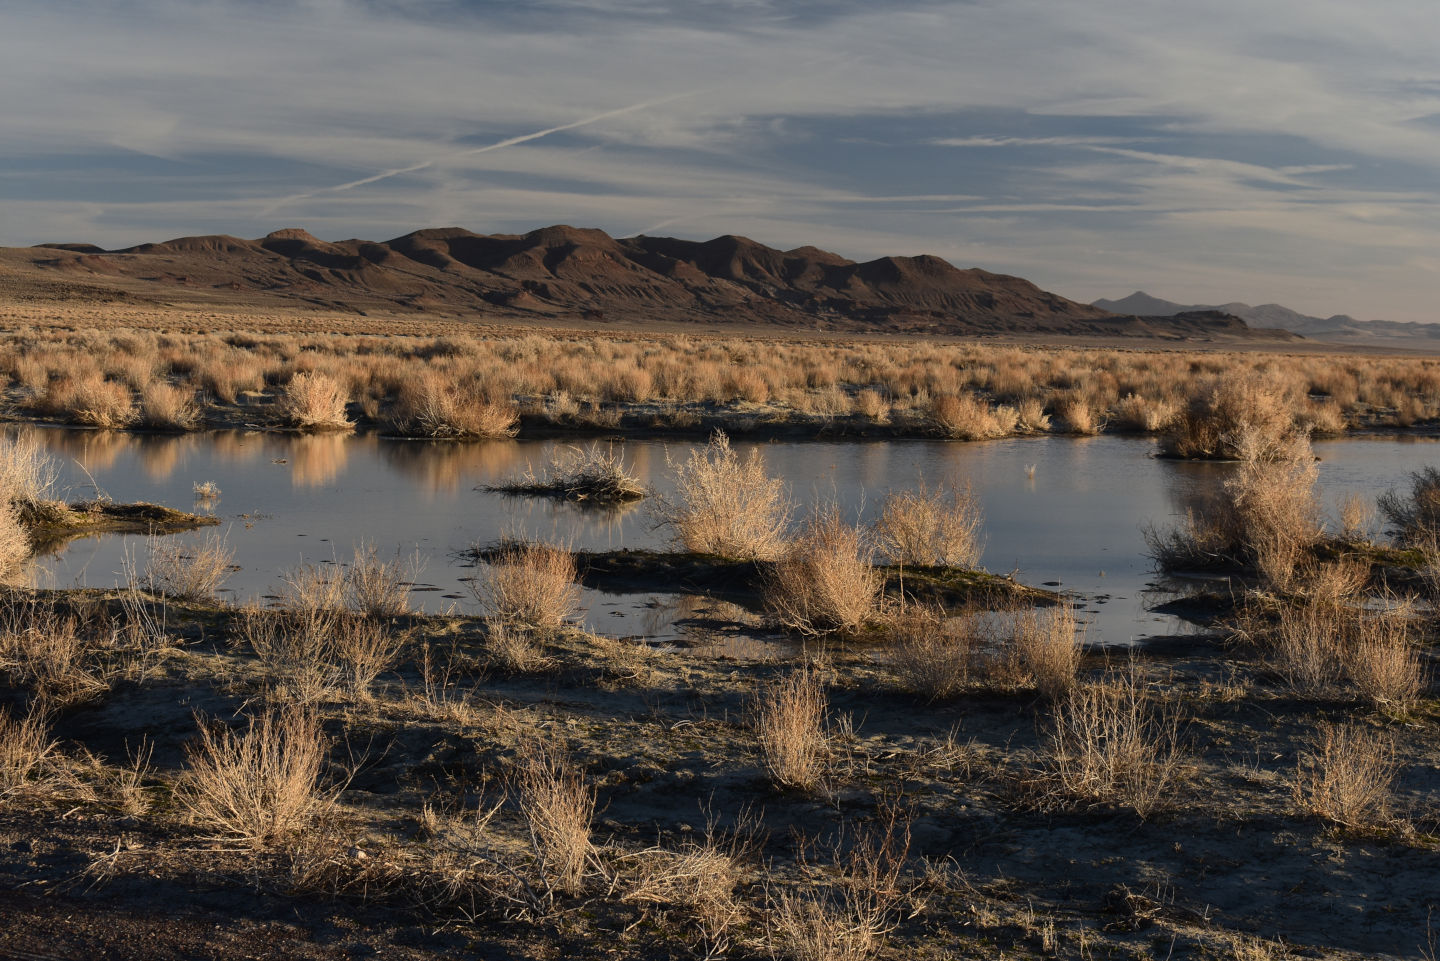
Looking to the northwest across Bass Flat Southwest Pond with “Carson Lake” at upper right. The ridge in the distance is at the northeast end of the White Throne Mountains and displays horizontal beach terraces formed on the shore of Lake Lahontan, which was about as big as Lake Ontario 15,000 years ago (Benson, 1994). The lake has since evaporated except for remnants at Pyramid Lake and Walker Lake. It could return with another major glacial episode and put a fitting end to the Newlands Project.
A fairy shrimp in a narrow band of ice-free water along the shore of Bass Flat Southwest Pond in the morning. Its intestine has brownish-green food extending the full length of the body. There is a bit of ice at upper right. This female was scraping the pond bottom with its legs and wasn’t moving much so I could measure its length at a whopping 35 mm. I measured the water temperature as 4 C at another location a little later. Intentionally or not, this fairy shrimp has come to a location where the water is warming up more quickly than under the ice.
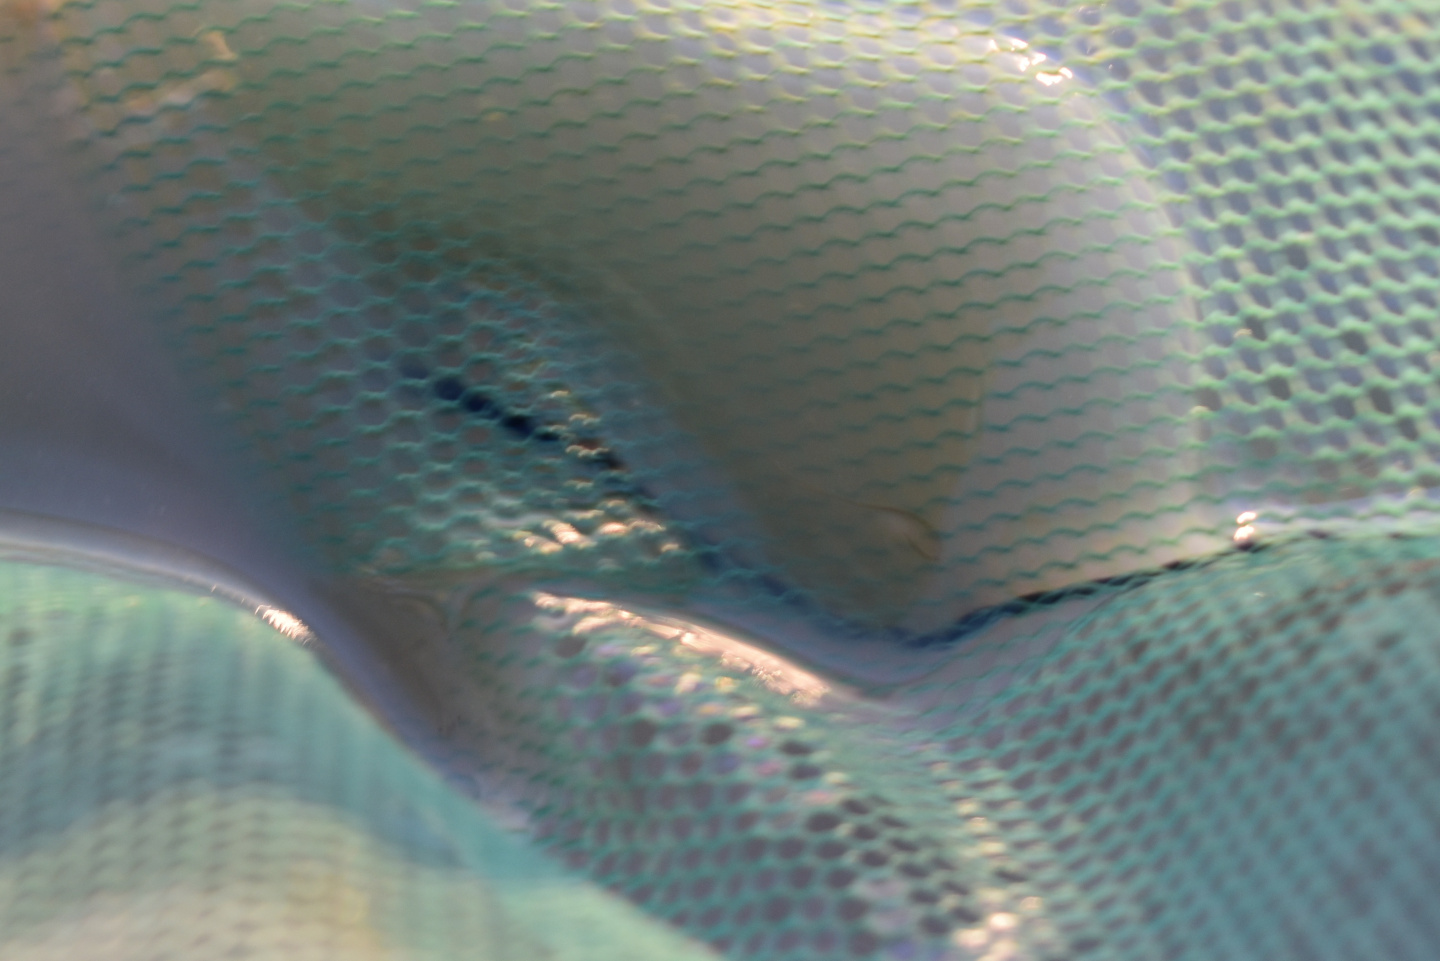
Fairy shrimp swimming below the ice on Bass Flat Southwest Pond in the morning. The pale eggs in the ovisac below center are the most visible part of the fairy shrimp. The fairy shrimp’s broad leg-bearing thorax is to the right of the eggs and slightly darker than the water. For more, see the video below. For another example of fairy shrimp swimming under ice, see Stinking Springs Well Pond (on February 23, 2022, Rawhide Flats).
Bass Flat Southwest Pond Fairy Shrimp Video 2022-02-09r
For a 46-seconds video of a fairy shrimp swimming under the ice on Bass Flat Southwest Pond in the morning, click on the video player above. There is no audio. At the start of the video, the net is seen resting on the ice. There is something moving under the ice next to it. Some pale clay is churned up. There is leg motion but the legs themselves are just a darker blur in the water.
How extraordinary is fairy shrimp swimming under ice? Well, not so much. Daborn (1976, see References page) noted that Eubranchipus bundyi individuals that hatched in Alberta on April 8-9 stopped growing but continued swimming under ice after an April 24-25 storm until it all melted off by the 29th. Perhaps more applicable to Bass Flat Southwest Pond, Branchinecta mackini individuals in clay-rich pools on a Mojave Desert playa were reported swimming under ice by Brown and Carpelan (1971). That example came to mind when I found fairy shrimp at Stinking Springs Well Pond (Rawhide Flats) on January 13 even though the pond was completely covered by ice until late morning. So if I got to a pond before the ice melted, I looked extra hard. That didn’t work at Labou Playa North Pond (Fairview Valley), but it worked here.
A fairy shrimp of the smaller generation in the net at Bass Flat Southwest Pond in the afternoon after most of the ice had melted. This one is about 12 mm long.
A female fairy shrimp in Bass Flat Southwest Pond. When I came back in the afternoon, I caught this large female with an ovisac stuffed full of pale eggs.
Fairy shrimp and water boatmen in the net at Bass Flat Southwest Pond in the afternoon. This is a fortuitously informative net haul as it has a fairy shrimp of the large generation, a fairy shrimp of the small generation, and 3 dark water boatmen (sub-order Heteroptera, family Corixidae).
February 15, 2024
Reno got 2.2 cm precipitation on January 10 (16 cm snow measured), another 0.25 cm on January 22, and then 2.0 cm (21.6 cm snow) on February 4-5 so there is a good chance for water in “Carson Lake” Playa ponds. “Carson Lake” itself is still flooded and has been since March 2023. There were numerous puddles on the road from US 95 but all but a few could be avoided and those that couldn’t weren’t too soft.
Bass Flat Southwest Pond is a casualty of the rains of 2023. The dam on the north edge of the pond has been breached and the pond is essentially dry. However, there are a few small puddles here and there so WIDLA.
- 1 m x 2 m; 8 cm maximum depth.
- Opaque pale brown water; 7 C in 3 cm water at 1015.
- Pale gray fairy shrimp 10-13 mm long; no eggs seen.
- No other animals observed.
Looking south through the breach in dam on north side of Bass Flat Southwest Pond, from downstream side. The channel is more than 20 cm lower than the ground surface north of the dam.
View from dam to southwest across dry bottom of Bass Flat Southwest Pond. Below center, a channel is cut into the floor of the pond and leads through the dam breach. The view from here is not good for fairy shrimp but there are a few puddles among the now prolific tumbleweeds.
A puddle on the mostly dry floor of Bass Flat Southwest Pond. It doesn’t look like much but parts of it are deeper than 5 cm. This would have been near the western edge of the former Bass Flat Southwest Pond.
Fairy shrimp from puddle at Bass Flat Southwest Pond swimming in a white container. The one at right is about 13 mm long. Neither of the fairy shrimp has eggs although I have seen eggs on fairy shrimp of this size at different times elsewhere. They may be males or immature females.
Wildcat Freight Station Pond (Nevada Department of Wildlife)
Wildcat Freight Station Pond is another anthropogenic feature on the “Carson Lake” playa. It is water that ponds on the south side of a causeway road at the southeast edge of “Carson Lake and Pasture” and north of Bass Flat. It is less than 1 km (0.6 miles) northeast of Wildcat Freight Station, which is 23 km (14 miles) south of Fallon. The pond is visible from the hill above the freight station and from the freight station itself if you stand in the right spot. There is a small culvert under the causeway in the eastern part of the pond that is partially blocked by a solid wooden gate less than 50 cm (20″) high. At the time of the February 2022 visit, the gate was down and water about 15 cm deep was pooled above it. There was also a puddle of similar depth at the other end of the culvert. Small trees along the causeway and thick rabbitbrush south of the causeway suggest water commonly collects at this location. The pond is in the area of public lands that was transferred to the state of Nevada. There is no signage to demarcate the edge of public lands formerly managed by Bureau of Reclamation from those managed by BLM or to mark the edge of lands now managed by NDOW. The 5-wire fence around “Carson Lake and Pasture” is not a property boundary.
According to the interpretive sign at the ruins of the freight station, the Wildcat Freight Station is on the Pony Express trail but was constructed a couple of years later for a freight road from Fort Churchill to Sand Mountain on the far side of Salt Wells Basin.
Wildcat Freight Station Pond can be reached by way of Bass Flat Southwest Pond. Instead of bearing right at the Y intersection at Bass Flat Southwest Pond continue straight on a poor road. After about 1 1/2 miles, this road reaches a fence and a road junction. The road that continues to the northeast becomes very poor. Another road follows the fence to the northwest to Wildcat Freight Station, which is not quite 1 1/2 miles away. The road from Bass Flat Southwest Pond to the fence is all clay and likely impassable when wet. There is another road that leads to the west from Wildcat Freight Station. If it connects to US 95 about 4 miles to the west, it could be a better route.
Elevation: 1,193 m (3,915′)
February 9, 2022
I was planning to hike up the hill above the Wildcat Freight Station to get a view of “Carson Lake” playa and what might be out there. Luckily, I could drive all the way to the freight station. I saw some ponds in the southwestern part of the playa but they seemed to be in the now-brown “wet meadow and pasture” and consequently were of no interest. “Carson Lake” itself was rather extensive. There was a huge area of white, vegetation-free playa south of the lake which I surmise to be the grand “Sump” of the Newlands Project, where the bad irrigation water goes to evaporate. And then there was Wildcat Freight Station Pond backed up against the road around the edge of “Carson Lake and Pasture”. What a treat.
The pond has been heavily trampled by cattle so the bottom is treacherously pock-marked. The pocks are big and steep-sided and can’t be seen. They are a serious challenge to balance.
- Less than 20 m wide and maybe 250 m long; up to 20 cm deep in holes on the irregular bottom.
- Cloudy pale brown water; 12 C at 6 cm depth in sun at 1400.
- No fairy shrimp.
- Common water boatmen (sub-order Heteroptera, family Corixidae) of many sizes, mostly less than 10 mm long.
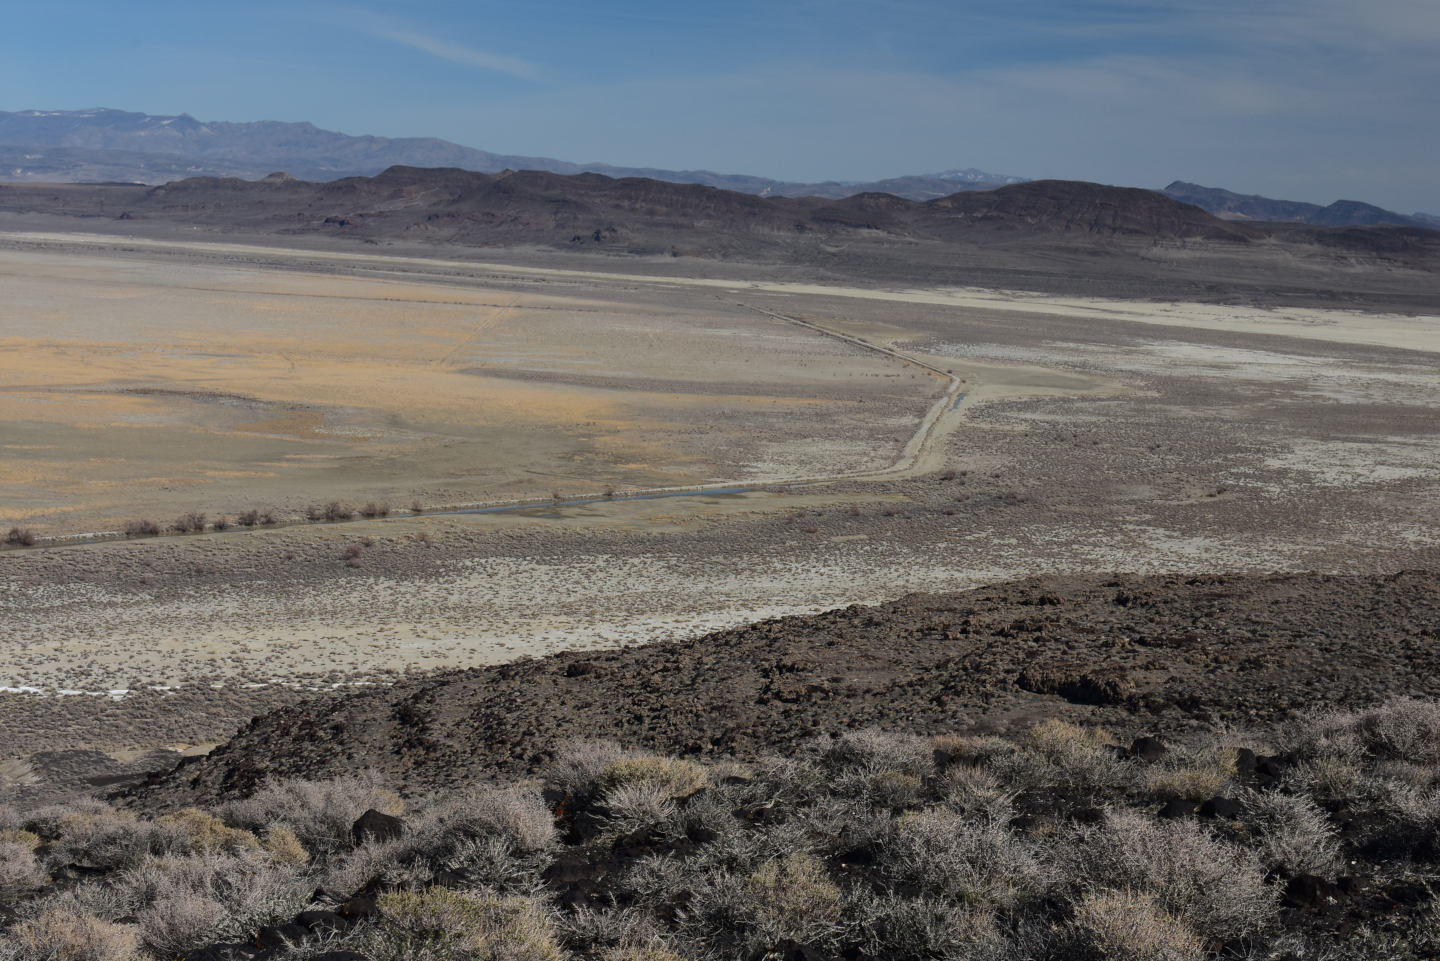
Looking northeast from the hill above Wildcat Freight Station at Wildcat Freight Station Pond, with Bunejug Mountains in the distance. The pond is at center to the left of the nearer bend in the causeway road and to the right of the cluster of trees. “Carson Lake and Pasture” is at left and Bass Flat is at far right.
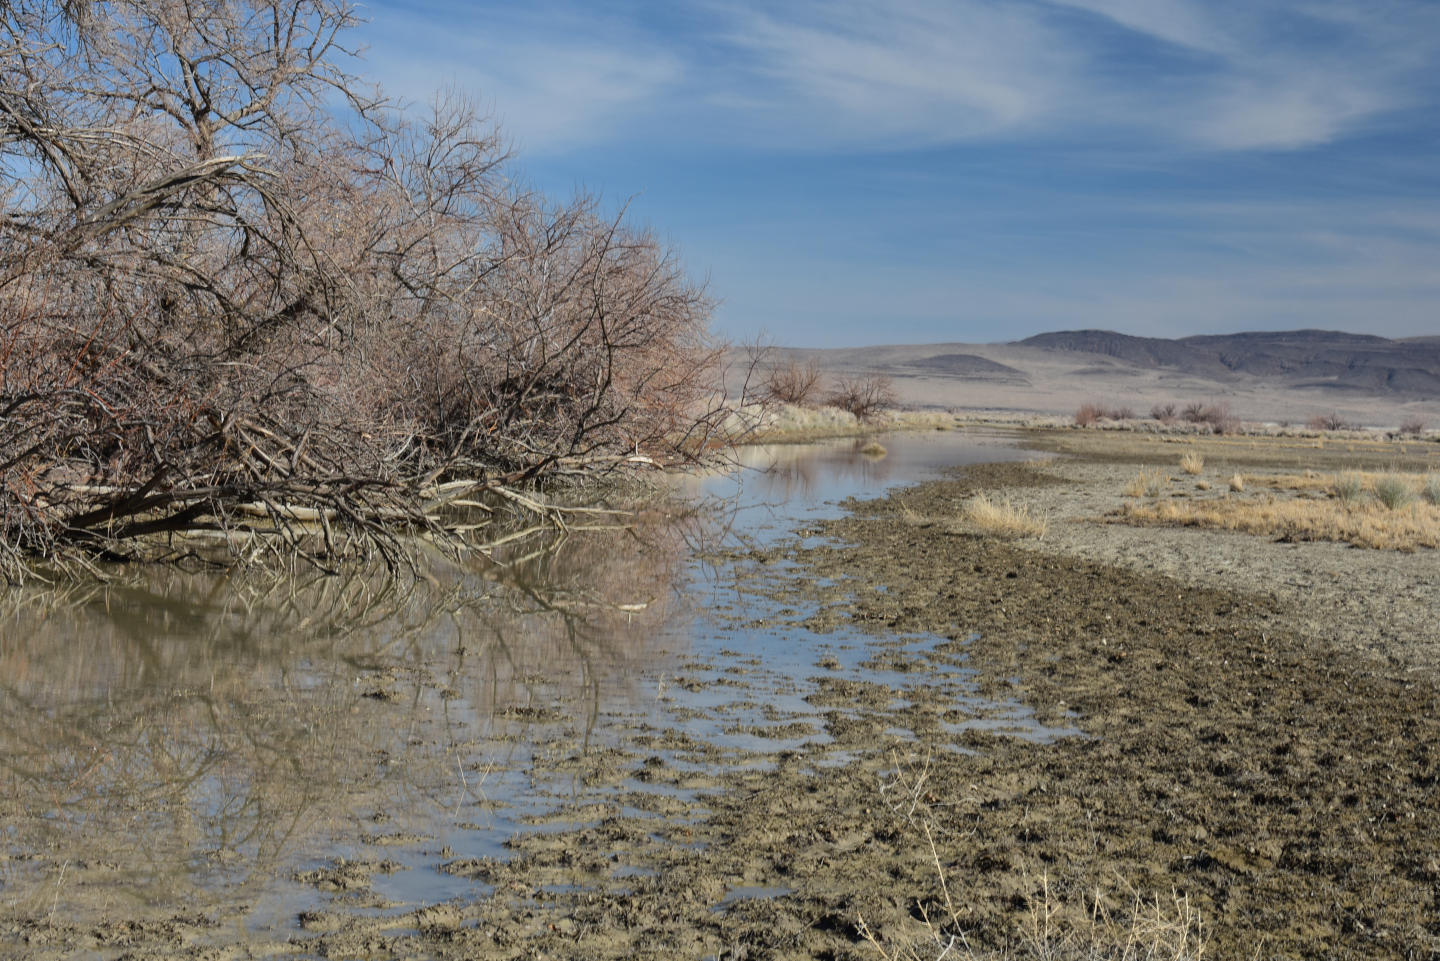
View to the east of Wildcat Freight Station Pond with the north end of the Cocoon Mountains in the distance. A road is on top of the causeway at left. The pond has been heavily trampled by cows.
Winter 2022 Fairy Shrimp Hatching History on “Carson Lake” Playa and Rawhide Flats
The presence of fairy shrimp in ponds in January and February after 2 major storms in December presents an opportunity to try to figure out when they hatched and why. The unusual weather pattern of winter 2021-2022 means the date when the ponds in western Nevada filled up with water (i.e., the earliest hatching date) can be determined without repeated observations of the ponds over the months. Temperature and precipitation data for Reno are available from NOAA Online Weather (NOW) Data at www.weather.gov/wrh/Climate?wfo-rev or from WFO monthly summaries at forecast.weather.gov/product.php?site=CRH&issuedby=RNO&product=CF6&format=CI&version=2&glossary=0 (“RNO” is the code for Reno and the last full month of data is on page 2). Although precipitation amounts at various ponds in western Nevada may have differed from those in Reno, the timing of large precipitation events is unlikely to have differed from Reno by more than 1/2 day (EIGWUU). The latest a particular generation of fairy shrimp in a particular pond could have hatched is constrained by my first observation of them. This constraint can be considerably tightened by assuming a reasonable growth rate and extrapolating back to zero body length.
Reno weather strongly suggests the earliest possible winter 2021-2022 hatching date for fairy shrimp in western Nevada was December 23. There was negligible precipitation in Reno in November. 7.4 cm of precipitation (as depth of water) fell during a big storm on October 24-25 but any ponds that formed then and any fairy shrimp in them are unlikely to have survived until January due to the mid-December freeze (see below). Reno received 7.1 cm of precipitation in the period December 12-26. Reno received 0 cm precipitation in January and 1.1 cm on February 21-23. Consequently, any ponds found before February 21 must have formed in the period December 12-26.
Hatching dates within the December 12-26 period can be further constrained by temperatures and the precise timing of precipitation. Reno received less than 0.5 cm of precipitation on December 6th, 9th, and 12th and then 2.1 cm on December 13-14 during the first big storm of December. Ponds likely formed as a result of this storm. However, averages of the daily high and low temperatures in Reno for December 14-21 were -1.9 to 2.2 C with only 2 daily averages above 0 C. On December 22, Wrecked Windmill Pond and Playa Wire Gate Pond (Soda Spring Valley) were found to be frozen solid with up to 10 cm of ice and condensed snow just before the second December storm. These ponds are less than 150 m (490′) higher in elevation than those on “Carson Lake” Playa and Rawhide Flats and more than 370 m (1,210′) lower than ponds in the Garfield Hills, Candelaria Hills, and Gabbs Valley Range. Even if fairy shrimp hatched before the water froze, they would have been frozen in the ice over the next few days. December 23 was the big dump of the second storm with 3.6 cm. Another 0.9 cm accumulated over the next 3 days. Temperatures were warmer on December 22-24 but then the daily averages of the high and low temperatures were 0.6 C or less from December 26 to January 2, except for 2.8 C on December 30. Most ponds likely froze solid again. Thus, while it is possible that liquid water and fairy shrimp that hatched as early as December 23 survived (e.g., due to greater water depths, insulating effects of snow cover), the most probable hatching dates are after January 2 as snow and ice in the ponds melted.
The latest that fairy shrimp could have hatched is the day before I observed them. A guess of how long before my observation they hatched can be based on a growth rate. Daborn (1977) found an average rate of about 1 mm/day for a Branchinecta mackini population in a clay-rich Alberta pond. Other B. mackini populations on a playa in the Mojave Desert grew at rates of 0.6-2 mm/day at various times over 2 years (Brown and Carpelan, 1971). A winter generation of Eubranchipus holmani had growth rates of 0.87 mm/day for the first 9 days and then 0.32 mm/day (Moore, 1963). Brown and Carpelan (1971) inferred that the rapid growth of B. mackini in the Mojave Desert almost stopped once they reached a 10 mm length while the gonads developed. Growth resumed after maturation and the rate decreased as the maximum length was approached. Another consideration is that fairy shrimp grow more slowly in cold water than warm water, e.g. Mono Lake fairy shrimp as reported by Jones and Stokes Associates (1993b, p. J-2). To simplify the analysis I just assume a growth rate of 1 mm/day and then check to see if the result is reasonable.
How do you figure out why they hatched? Laboratory experiments have shown that fairy shrimp species hatch at some temperatures and TDS concentrations but not at others (e.g., Horne, 1967; Brown and Carpelan, 1971; Belk, 1977; see “Habitats” on the Biology of Anostraca page). I can’t measure TDS, or a TDS proxy like conductivity, but I know most ponds had their minimum TDS concentrations whenever the ice melted after the second December storm. Once all the ice and snow had melted, TDS would increase continually with slow winter evaporation. Thus, fairy shrimp either hatched at the minimum TDS of the thaw or during a later period of rising TDS, notwithstanding TDS changes related to daily freeze-thaw cycles of surface ice. As for temperature, I can use the maximum and minimum daily temperatures in Reno as reported on National Weather Service web pages (see above) to define temperature trends. These should be more or less the same throughout western Nevada. This gives me 4 possible causes to choose from:
- They hatched upon first pond filling/melting.
- They hatched during a period of rising temperature.
- They hatched during a period of falling temperature.
- They hatched during a period of trendless temperature.
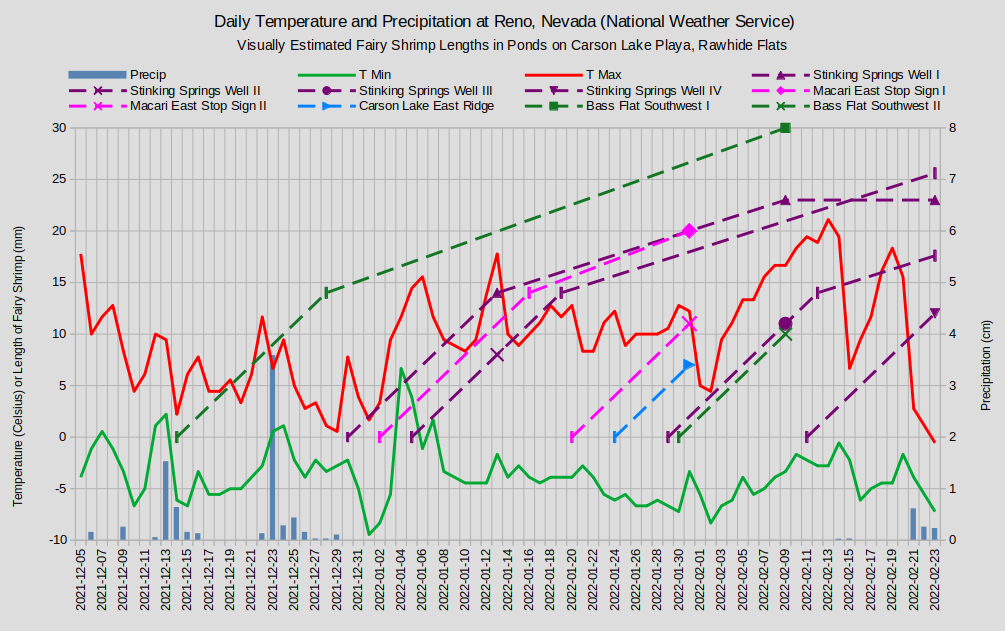
Fairy shrimp lengths are indicated by the dashed lines where 0 lengths are on the inferred days of hatching. The vertical dash symbol indicates a calculated length. From hatching to 14 mm length, the growth rate is assumed to be 1 mm/day. For post-14 mm growth rates, see text below. Lengths of Macari East Stop Sign Pond generation III coincide with those Carson Lake East Ridge Pond generation I and are not shown separately.
As shown on “Graph of Temperature and Precipitation in Reno and Fairy Shrimp Lengths in Stinking Springs Well Pond on Rawhide Flats and Macari East Stop Sign Pond, “Carson Lake” East Ridge Pond, and Bass Flat Southwest Pond on “Carson Lake” Playa, Winter 2022″, I observed 14 mm (range 12-15 mm) fairy shrimp in Stinking Springs Well Pond on Rawhide Flats on January 13. Assuming a growth rate of 1 mm/day gives an approximate hatching date for this generation I of December 30. December 30 was during a cold spell. The high was above preceding and following days but the average of the high and low air temperature was below 5 C. Some fairy shrimp species hatch in 5 C water (e.g., Belk, 1977, see References page). If generation I grew at a rate as slow as 0.7 mm/day, they could have hatched due to pond filling on Christmas Eve, when the low temperature was above freezing and high temperatures had been relatively warm for 2 days. If generation I did hatch in the December 24-30 period, they survived the -9.4 C low, or whatever the actual water temperature was in the pond, on New Year’s Day. It’s seems less likely that generation I waited for the rising temperatures after January 2 and grew at a rate of 1.3 mm/day or faster. On February 9, generation I of Stinking Springs Well Pond was about 23 mm long. That indicates an average growth rate of 0.33 mm/day since January 13 and is consistent with the observations of Moore (1963) and Brown and Carpelan (1971) for post-maturity fairy shrimp. On February 23, the longest fairy shrimp in Stinking Springs Well Pond were still about 23 mm long so generation I either stopped growing or died off.
Generation II in Stinking Springs Well Pond was about 8 mm long on January 13. The hatch of generation II cannot be precisely dated but it occurred during a warming trend after the New Year’s Eve cold snap. A 1 mm/day rate would have them hatching on January 5, within the January 3-7 warm spell. What happened to them after that cannot be determined from my observations. If they grew at a rate of 1 mm/day until assumed maturity at 14 mm long and then grew at the same post-maturity rate as generation I, they would have been about 21 mm long on February 9 and visually indistinguishable from generation I. If they kept growing at that rate, they would have been a little over 25 mm long on February 23. They could also have stopped growing or grown more slowly in the 20-25 mm range. My notes describe the large fairy shrimp on February 23 as “20-25 mm”. That could include both generations I and II.
The assumed inflection point for the growth rate at a length of 14 mm is based on observations of generation I and is an artifact of my infrequent observations. It would have been different if I had visited the pond a few days before or a few days later. It is nonetheless within 50% of Brown and Carpelan’s (1971) growth pause of 10 mm. Growth rates of fairy shrimp in Garfield 5890 Saddle Pond slowed before they reached 10 mm (see “Winter 2022 Fairy Shrimp Hatching History in the Garfield and Candelaria Hills and the Gabbs Valley Range” on the Garfield Hills page). Whatever the details, the principle of a change in growth rate must be valid because projecting back to 0 length of Stinking Springs Well Pond generation I from 23 mm on February 9 using the observed rate of 0.33 mm/day gives a hatching date of December 2. That would have been after a mostly dry November with the largest precipitation event delivering only 0.18 cm water on November 9.
On February 9, I saw “fairy shrimp of various sizes 10-25 mm” long in Stinking Springs Well Pond. Those closer to 25 mm were generations I and II. At least 1 other generation must have hatched to account for the smallest fairy shrimp. For discussion purposes, generation III had an average length of 11 mm on February 9. A wide range of growth rates would have them hatching during a period of trendless temperature, e.g., before January 29 for rates less than 1 mm/day. Using the same method as I did for generation II, generation III reached a mature length of 14 mm on February 12 and then grew more slowly to about 17.5 mm on February 23. I did not see fairy shrimp less than about 20 mm or greater than about 12 mm long on February 23. That could be because generation III grew much faster or much slower than its predecessors. A more obvious explanation is I missed them.
The 12 mm long fairy shrimp I observed in Stinking Springs Well Pond on February 23 are a fourth generation. Reasonable growth rates would have them hatching on about February 11 during a warming trend.
The hatching history of fairy shrimp in Stinking Springs Well Pond in winter 2021-2022 is a 2-by-4-to-the-head sort of introduction to winter fairy shrimping. It appears that there were at least 4 generations. 2 hatched during periods of warming temperature, 1 hatched during a trendless period, and 1 hatched during a cold spell during or several days after initial pond filling. Generation I cannot have hatched due to thawing of previously frozen snowmelt because low temperatures fell almost continuously from December 24 to January 3. Some snowmelt must have escaped freezing in spite of the post-Christmas cold. Multiple generations of fairy shrimp hatch and live out their lives in winter ponds that ice over almost every night – little did I know.
A couple of weeks after my first visit to Stinking Springs Well Pond, I found 20 mm fairy shrimp in Macari East Stop Sign Pond. Because my January 31 observations are more detailed, I use that data and assume that the 20 mm generation of fairy shrimp on January 27 is the 20 mm generation on January 31 and that growth was not evident because of imprecise length estimates, or observations not representative of the populations, or insufficient time for perceptible growth. The 20 mm fairy shrimp were already larger than the size at which the growth rate of Stinking Springs Well Pond fairy shrimp had slowed. Extrapolating back to 0 length assuming a constant 1 mm/day growth rate is not justified. As the 20 mm length conveniently falls on the growth trajectory for Stinking Springs Well Pond generation I, the simplest interpretation would be that that Macari East Stop Sign Pond generation I hatched on the same day as Stinking Springs Well Pond generation I. Rather than plotting the 2 generations on top of each other, I assumed a post-maturity growth rate of 0.4 mm/day. With that rate, Macari East Stop Sign Pond generation I was 14 mm on January 16 and hatched on January 2. That’s 4 days later than Stinking Springs Well Pond generation I and provides a glimpse into the uncertainties of this analysis.
Macari East Stop Sign Pond had a second, 11 mm long (range 10-12 mm) generation on January 31. A growth rate of 1 mm/day implies they hatched on January 20. Any pre-maturity growth rate between 0.7 mm/day and 5 mm/day would have them hatching during the January 15-28 period of trendless temperatures.
On January 31, Macari East Stop Sign Pond had a third generation with a length of about 7 mm (“less than 8 mm” in notes). As for Macari East Stop Sign Pond generation II, any reasonable growth rate leaves generation III hatching during a period of trendless temperatures. Macari East Stop Sign Pond generation III is not shown on “Graph of Temperature and Precipitation in Reno and Fairy Shrimp Lengths in Stinking Springs Well Pond on Rawhide Flats and Macari East Stop Sign Pond, “Carson Lake” East Ridge Pond, and Bass Flat Southwest Pond on “Carson Lake” Playa, Winter 2022″ to avoid overlapping the “Carson Lake” East Ridge Pond fairy shrimp generation.
At the time of my visit to Bass Flat Southwest Pond, I wrote down only the length of the 35 mm long fairy shrimp that I measured in the morning while the pond was still mostly iced over and “about 10 mm” for a smaller group. I saw a greater range of lengths for large fairy shrimp when I revisited the pond in the afternoon but didn’t revise my notes. A wide length range is also evident in my photographs. For discussion purposes, Bass Flat Southwest Pond generation I was 30 mm and generation II was 10 mm on February 9.
With 3 variables – pre-maturity growth rate, mature length, and post-maturity growth rate – and a very long observed length of 30 mm, no reconstruction of the growth of Bass Flat Southwest Pond generation I is going to be convincing. Nonetheless, it is worth the effort to illustrate the range of possibilities and to blow one of my initial assumptions out of the water. On “Graph of Temperature and Precipitation in Reno and Fairy Shrimp Lengths in Stinking Springs Well Pond on Rawhide Flats and Macari East Stop Sign Pond, “Carson Lake” East Ridge Pond, and Bass Flat Southwest Pond on “Carson Lake” Playa, Winter 2022″, I assumed a pre-maturity growth rate of 1 mm/day, a mature length of 14 mm, and a post-maturity growth rate of 0.38 mm/day. Ha, ha! They hatched on December 14 after the first December storm and weren’t frozen like I said they would be. Ooh, but if I increase the post-maturity growth rate to just 0.49 mm/day, they hatched on December 24, right after the second December storm and I was right after all. But then if I assume the same post-maturity growth rate as Stinking Springs Well Pond generation I, or 0.33 mm/day, and a mature length of 10 mm, like Brown and Carpelan (1971), they hatched in a dry pond on November 30.
The case for Bass Flat Southwest Pond generation II is better constrained as they were only 10 mm long on February 9. If generation II grew faster than 1.5 mm/day, they hatched when the temperature started rising after the cold days of February 1-2. That seems unlikely. A 1 mm/day pre-maturity growth rate has them hatching on January 30 at the end of a long period trendless temperature, as would any reasonable slower rates.
It’s possible that the 30 mm long fairy shrimp in Bass Flat Southwest Pond on February 9 are a different species than the 10 mm long fairy shrimp. Different species could also have been present in other ponds. While different species may be more likely to hatch under different conditions or grow at different rates than populations of the same species, that leaves open the question of why the different species hatched at different times.
As my first attempt to discern a temperature-related cause for fairy shrimp hatching, the results for “Carson Lake” Playa and Rawhide Flats fairy shrimp are very illuminating. There doesn’t appear to be one. Temperature could still be a hatching trigger but it would have to be something more complex than a temperature trend, or it would have to act in concert with other triggers, or both.
- Generations that hatched during a warming period:
- Stinking Springs Well Pond generation II (8 mm on January 13)
- Stinking Springs Well Pond generation IV (12 mm on February 23)
- possibly Macari East Stop Sign Pond generation I (20 mm on January 31)
- Generations that hatched during a trendless period:
- Stinking Springs Well Pond generation III (11 mm February 9)
- Macari East Stop Sign Pond generation II (11 mm on January 31)
- Macari East Stop Sign Pond generation III (7 mm on January 31)
- “Carson Lake” East Ridge Pond generation I (7 mm on January 31)
- possibly Bass Flat Southwest Pond generation II (10 mm on February 9)
- Generations that hatched during a cooling period which was also the time of initial pond filling:
- Stinking Springs Well Pond generation I (14 mm on January 13)
- possibly Macari East Stop Sign Pond generation I (20 mm on January 31)
- possibly Bass Flat Southwest Pond generation I (30 mm on February 9), whether after the first or the second December storm
- Generations that hatched during a cooling period which was not the time of initial pond filling:
- possibly Macari East Stop Sign Pond generation I (20 mm on January 31)
- possibly Bass Flat Southwest Pond generation I (30 mm on February 9), whether after the first or the second December storm
Most importantly, fairy shrimp on “Carson Lake” Playa and Rawhide Flats hatched on multiple occasions after the initial pond filling, whatever the cause. The moral is: it’s worth going back to winter ponds in these areas and maybe to ponds in other areas if you can find the time.
For additional hatching histories see “Winter 2022 Fairy Shrimp Hatching History in Soda Spring Valley and Rhodes Salt Marsh” on the Soda Spring Valley page and “Winter 2022 Fairy Shrimp Hatching History in the Garfield and Candelaria Hills and the Gabbs Valley Range” on the Garfield Hills page.
What Can We Learn from the Ponds on “Carson Lake” Playa?
Fairy shrimp are still present on “Carson Lake” Playa in a few places that are not hydraulically connected to the post-1900 duck farm, cow pasture, and irrigation water dumping grounds of “Carson Lake and Pasture”. They were found in 3 of 5 ephemeral ponds.
Very numerous water birds visit large, semi-permanent, water bodies which have fish at “Carson Lake and Pasture” and Stillwater National Wildlife Refuge and the surrounding crop fields. In spite of the likely dispersal by birds of fairy shrimp resting eggs to all water bodies on an annual basis and the likelihood of wind dispersal, some ephemeral ponds appear to lack fairy shrimp.
Fairy shrimp on “Carson Lake” Playa have adapted to hatching and growing to maturity in the winter, when ponds generally ice over during the night.
Fairy shrimp on “Carson Lake” playa seem to really like clay.